


User’s Manual for InterForm400®
445
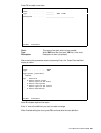
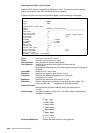
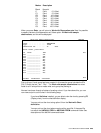
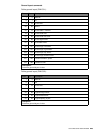
Marker Description
Blank No point
C Point 0 % filled
C1 Point 2 % filled
C2 Point 10 % filled
C3 Point 20 % filled
C4 Point 35 % filled
C5 Point 55 % filled
C6 Point 80 % filled
C7 Point 99 % filled
C8 Point 100 % filled
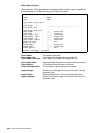
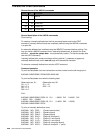
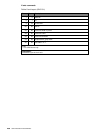
When you press Enter, you will return to Work with Observation sets. Now it is possible
to appoint values to this observation set. Select option 12=Work with sample
observations, and this will be displayed:
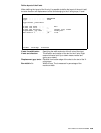
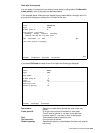
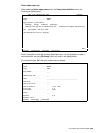
Work with Sample observations CHS200D
Chart . . . . . . . . . : SAMPLELINE
Type . . . . . . . . . . : *LINE
Observation set . . . . : S1 Demo
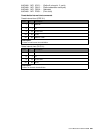
Enter values, press Enter.
ID Value Text Dec
P01 ________________ Jan.
P02 ________________ Feb.
P03 ________________ Mar.
P04 ________________ Apr.
P05 ________________ May
P06 ________________ Jun.
P07 ________________ Jul.
P08 ________________ Aug.
P09 ________________ Sep.
P10 ________________ Okt.
P11 ________________ Nov.
P12 ________________ Dec.
End
F3=Exit F5=Refresh F12=Cancel
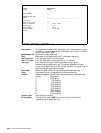
Prior to this an X-axis group has been created. In this case the group includes the ID’s
P01-P12 with the text, ’Jan.’- ’Dec.’. The Work with sample observations has value
fields for all X-axis points no matter what -axis group they belong to.
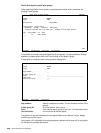
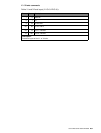
Now we have been through all states of creating a chart. If you have done this, you can
now view and print out the chart in the following ways:
If you have Swiftview installed, you are able to view the chart by pressing F5
(Display chart), from the chart definition display.
You can print out the chart using option 6 from the Work with Chart
definitions.
You can print out the chart when merging with a spool file, if the spool file
has either the &&CHA01 PRCH or &&CHA01 PRCM command inside. See
descriptions of the &&CHA commands below.