444
User’s Manual for InterForm400
®
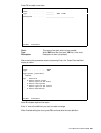
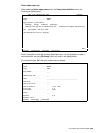
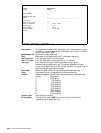
Change Observation set CHS110D
Chart . . . . . . . . . : SAMPLELINE
Type . . . . . . . . . . : *LINE
Seq number . . . . . . . : ___
Observation set . . . . . ___
Text . . . . . . . . . . . _______________________________________
Text font . . . . . . . . ____
Text font color . . . . . ___
Use Y1/Y2-axis . . . . . . _ 1=Y1, 2=Y2
Line type . . . . . . . . _ 1-9
Line width . . . . . . . . __ Dots
Point marker . . . . . . . _ C, C1-C8
Color . . . . . . . . . . ___
F3=Exit F4=Prompt F12=Cancel
Seq number: The sequence number of this observation set. The sequence number
is used for in which sequence this observation set is shown in relation
to other observation sets.
Observation set: Name of this observation set.
Text: Description of the observation set. Printed below the chart.
Text font/color: Font and color used for the text above.
Use Y1/Y2-axis: Links the observation set to either the Y1- or Y2-axis.
Line type: For charts with the type *LINE this decides the type of line
representing this observation set. The various types can be seen
above under ’Define layout of the Y1(and Y2)-axis’. The types used for
grid lines are the same as these types.
Line width: Define the width of the line representing this observation set.
Color Color used for the line representing this observation set.
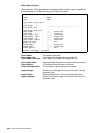
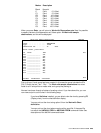
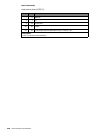
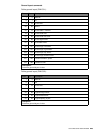
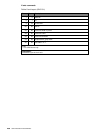
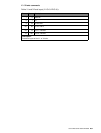
Pattern: Define the pattern inside the bars representing this observation set.
Pattern Description
0 100% white
1 2% shading
2 10% shading
3 20% shading
4 35% shading
5 55% shading
6 80% shading
7 99% shading
8 100% shading
Pattern color: Color filling for the bars.
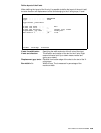
Point marker: For charts with type *LINE this decides the form of the points
representing this observation set.


