18
700 Tm Owner’s Manual
Console Layout (continued)
Displays:
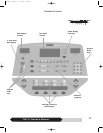
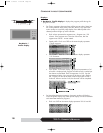
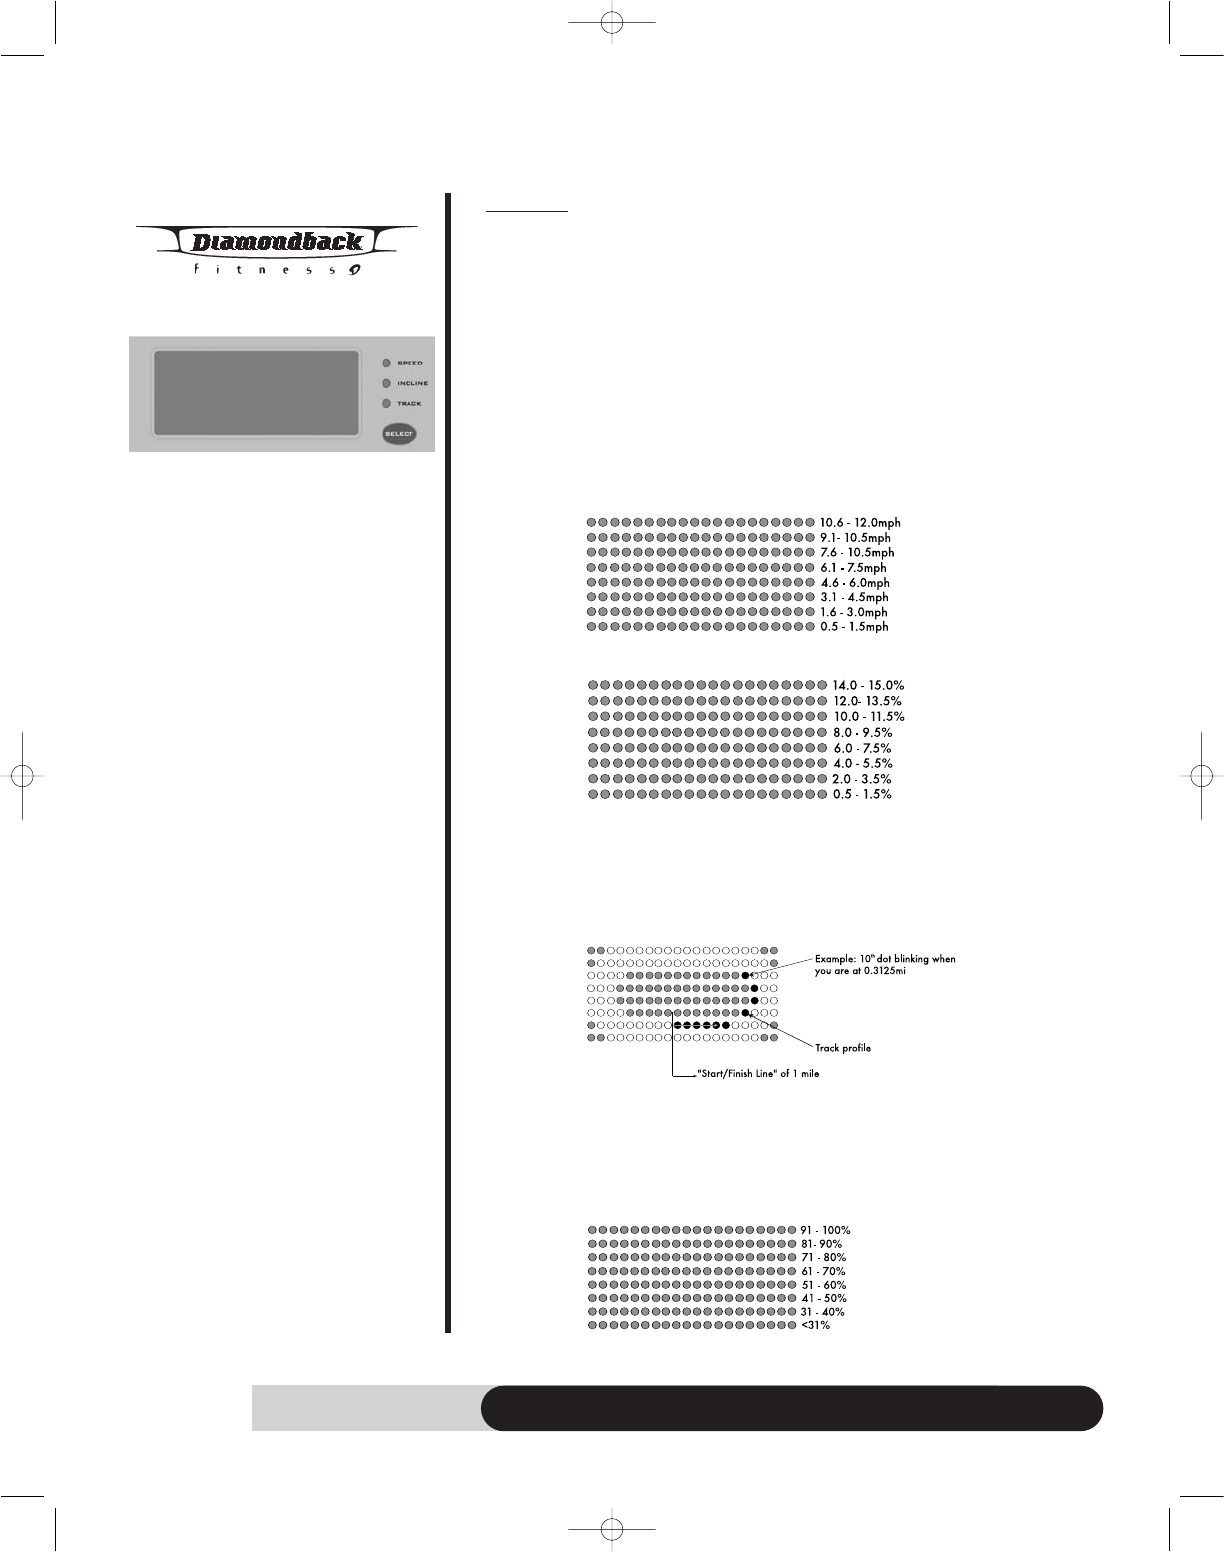
1. Dot Matrix /Profile display: It displays the program profile during the
program run mode.
• For Classic programs, there are three profiles you can select: Speed pro
file, Incline profile & Track profile. Press the “SELECT” key next to dot
matrix window to switch the profile display from default profile to the
selected profile and light up its LED indicator.
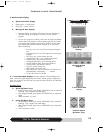
o Each column represents the segment time = Program time / 20
columns. If the program time is less than 20 minutes, then the
segment time will be 1 minute instead.
o Speed profile - Each row of LED at dot matrix display represents
1.5mph increment.
o Incline profile - Each row of LED at dot matrix display represents
1.5% increment.
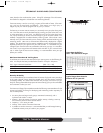
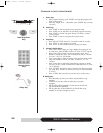
o Track profile - In the track display, a graphical representation of a 1
mile track is displayed and progress around the track is marked per
the distance accumulated. Each dot represents 1mi/32. See the
representation below. Your progress will be shown with a flashing
dot. Progress will start at the lower center and proceed counter
clockwise. When it reaches 1mile, the dot track will be completed.
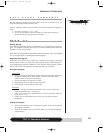
• For Heart Rate Interactive programs, dot matrix window will display
%max HR profile display only. Other profile display will not be available
with Heart Rate Interactive programs.
o Each row of LED at dot matrix display represents 10% of max HR.
Dot Matrix /
Profile display
700tmOM 8/24/06 11:15 AM Page 20


