


28
FITNESS TEST
33
1
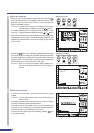
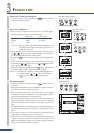
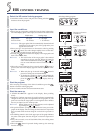
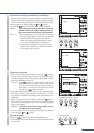
Select the Fitness test program.
•Attach the earlobe sensor, and press the
FITNESS
TEST
training selection
button to select the program.
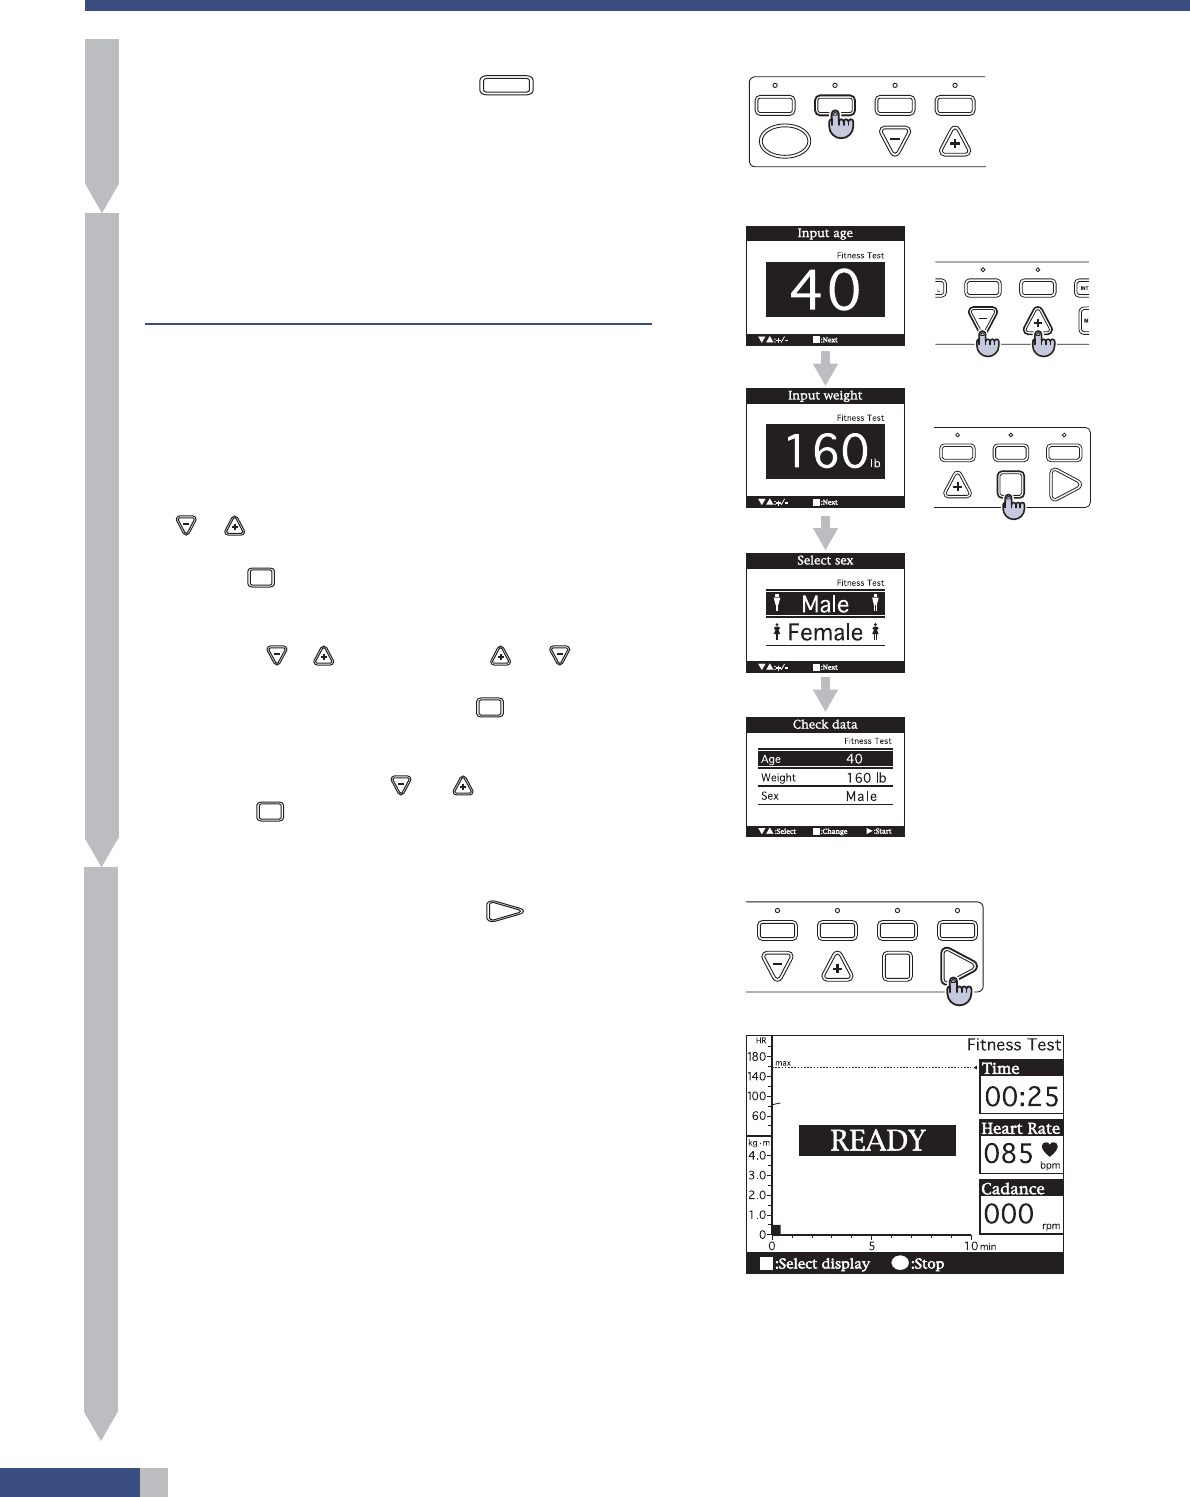
Input the conditions.
• Enter your age, weight, and sex in that order. The initial display,
prior to data input, is as shown in the table below:
Initial value Setting range
Age 40 years 10 - 99 years
Weight 160 lb 66 -286 lb
Sex Male
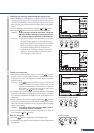
Reference: The upper pulse limit is automatically determined and
is displayed in the upper part of the graph after your
age has been entered.
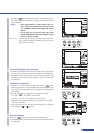
• Enter your age. You can increase or decrease the value by pressing
the
or button. The value changes rapidly if one or other but-
ton is pressed and held for more than a second.
• Pressing the
MODE
button switches the display to the weight and then
to sex.
• Again, in the case of weight, the value can be increased or decreased
by pressing the
or button; for sex, the and buttons alter-
nate between male and female.
•When the sex has been specified and the
MODE
button is pressed, the
data check display with the specified conditions appears.
Reference: To change the conditions, display and highlight the de-
sired item using the
and buttons, and then press
the
MODE
button. The input display then appears.
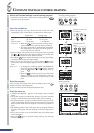
Start the program.
• After specifying the conditions, press the
START
button to start the
fitness test.
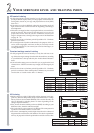
• The pulse measurement starts, and “READY” appears in the dis-
play. Wait for one minute without pedaling.
• When one minute has elapsed, “START” appears in the display,
and a buzzer sounds; start pedaling now. Keep pedaling so that the
60 rpm of the pedal cadence can be maintained.
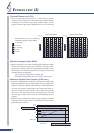
• The pedal resistance (torque) is indicated in the lower part of the
graph on the display. One dot along the horizontal axis represents
three seconds while two dots along the vertical axis represent 0.1
kg·m.
• The blinking numeric value in the upper part of the graph indicates
the pulse at that point. One dot along the vertical axis represents 2
bpm.
• Every three seconds, a row of dots blinks toward the right of the
graph. Thus, the training status can be monitored.
• At the fourth and seventh minutes, the pedal resistance changes ac-
cording to your pulse rate and it is indicated in the lower part of the
graph. For information related to the changes in pedal resistance,
refer to “EC-C400 test protocol” on page 31.
2
HILL
CONSTANT
WATTAGE
HR
CONTROL
FITNESS
TEST
STOP
Selecting training program
INTERVAL
HILL
CONSTANT
WATTAGE
QUICK
MODE
START
Starting program
Increase or decrease
of numbers
INTERVAL
HILL
QUICK
MODE
START
Changing item for
input
3
HILL
CONSTANT
WATTAGE