


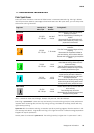
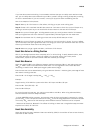
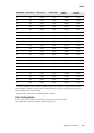
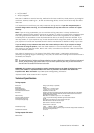

Men
Age / Years Very low Low Fair Moderate Good Very good Elite
20-24 < 32 32-37 38-43 44-50 51-56 57-62 > 62
25-29 < 31 31-35 36-42 43-48 49-53 54-59 > 59
30-34 < 29 29-34 35-40 41-45 46-51 52-56 > 56
35-39 < 28 28-32 33-38 39-43 44-48 49-54 > 54
40-44 < 26 26-31 32-35 36-41 42-46 47-51 > 51
45-49 < 25 25-29 30-34 35-39 40-43 44-48 > 48
50-54 < 24 24-27 28-32 33-36 37-41 42-46 > 46
55-59 < 22 22-26 27-30 31-34 35-39 40-43 > 43
60-65 < 21 21-24 25-28 29-32 33-36 37-40 > 40
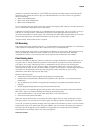
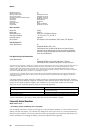
Women
Age / Years Very low Low Fair Moderate Good Very good Elite
20-24 < 27 27-31 32-36 37-41 42-46 47-51 > 51
25-29 < 26 26-30 31-35 36-40 41-44 45-49 > 49
30-34 < 25 25-29 30-33 34-37 38-42 43-46 > 46
35-39 < 24 24-27 28-31 32-35 36-40 41-44 > 44
40-44 < 22 22-25 26-29 30-33 34-37 38-41 > 41
45-49 < 21 21-23 24-27 28-31 32-35 36-38 > 38
50-54 < 19 19-22 23-25 26-29 30-32 33-36 > 36
55-59 < 18 18-20 21-23 24-27 28-30 31-33 > 33
60-65 < 16 16-18 19-21 22-24 25-27 28-30 > 30
The classification is based on a literature review of 62 studies where VO
2max
was measured directly in
healthy adult subjects in the USA, Canada and 7 European countries. Reference: Shvartz E, Reibold RC.
Aerobic fitness norms for males and females aged 6 to 75 years: a review. Aviat Space Environ Med;
61:3-11, 1990.
There may be some daily variation in the Running Indexes due to running circumstances e.g. surface,
hills, wind, temperature.
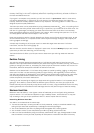
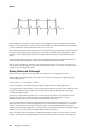
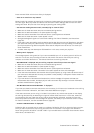
Long-term analysis
The single Running Index values form a trend that predicts your success in running certain distances.
The following chart estimates the duration that a runner can achieve in certain distances when performing
maximally. Use your long-term Running Index average in the interpretation of the chart. The prediction is
best for those Running Index values that have been received at speed and running circumstances similar
to the target performance.
ENGLISH
58 Background Information