


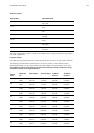
Short-term analysis
Running Index
Performance Level
< 30
Very poor
31-37
Poor
38-44
Fair
45-51
Average
52-58
Good
59-65
Very good
> 65
Excellent
There may be some daily variation in the Running Indexes due to running circumstances e.g. surface,
hills, wind, temperature.
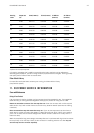
Long-term analysis
The single Running Index values form a trend that predicts your success in running certain distances.
The following chart estimates the duration that a runner can achieve in certain distances when
performing maximally. Use your long-term Running Index average in the interpretation of the chart.
The prediction is best for those Running Index values that have been received at speed and running
circumstances similar to the target performance.
Running
Index
Cooper test
(m)
5 km (h:mm:ss) 10 km (h:mm:ss) 21.098 km
(h:mm:ss)
42.195 km
(h:mm:ss)
36
1900 0:37:30 1:16:00 2:45:00 5:45:00
38
2000 0:35:00 1:11:30 2:34:00 5:20:00
40
2100 0:32:30 1:06:30 2:24:00 5:00:00
42
2200 0:30:45 1:03:00 2:16:00 4:45:00
44
2300 0:29:00 0:59:30 2:09:00 4:30:00
46
2400 0:28:00 0:57:30 2:04:00 4:20:00
48
2500 0:26:45 0:55:00 1:59:00 4:10:00
50
2600 0:25:30 0:52:30 1:54:00 4:00:00
52
2700 0:24:15 0:50:00 1:49:00 3:50:00
54
2850 0:23:15 0:48:00 1:44:00 3:40:00
56
2950 0:22:15 0:46:00 1:40:00 3:32:00
Polar RS400 User Manual 40