


94 Model Driven Systems Development with Rational Products
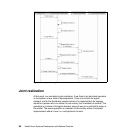
Model structure
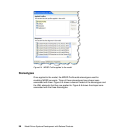
After beginning to create MDSD models, new modelers often ask, What is the
best way to represent and keep all this organized in a modeling tool such as
Rational Software Modeler or Rational System Developer? The answer of course
is that there are many possible ways to represent the work products. What we
describe here is one way to do this, which has been used with success during the
course of work with several clients.
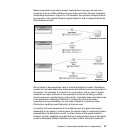
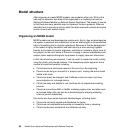
Organizing an MDSD model
MDSD models are best developed as creative acts, that is, they are developed as
the system is explored and understood, not as an afterthought or documentation
effort of something that is already understood. Because of this the development
of the model is highly interactive, and best done by a team working together.
Usually a core team of system engineers, architects or modelers, about three to
five people, do the lion’s share of the work, bringing in various stakeholders and
subject matter experts throughout the process to supply important information.
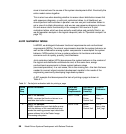
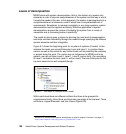
In this kind of working environment, it can be useful to create the model, initially
using flip charts and colored markers. This deceptively simple approach has a
number of important benefits, including:
Charts become a permanent record of the work from the beginning.
Charts can be hung on the wall of a “project room,” making the entire model
visible at all times.
Charts can easily be changed, and if different colors are used, can show
some indication of a change history.
Charts are easy and flexible to use, and thus do not impede the modeling
process.
Charts do not enforce UML or SysML modeling syntax rules, and allow work
to proceed faster (this can also be a disadvantage by allowing modeling
errors to persist undetected).
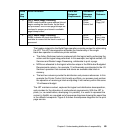
Flip charts also have some important disadvantages, including these:
Charts are not easily copied and distributed for review.
Charts are not automated and provide no traceability links or checking.
Charts can become unattractive and tattered over time.