


74
There may be some daily variation in the Running Indexes. Many factors influence Running Index. The value
you receive on a given day is affected by changes in running circumstances, for example different surface,
wind or temperature, in addition to other factors.
LONG-TERM ANALYSIS
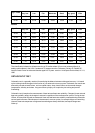
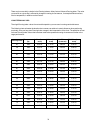
The single Running Index values form a trend that predicts your success in running certain distances.
The following chart estimates the duration that a runner can achieve in certain distances when performing
maximally. Use your long-term Running Index average in the interpretation of the chart. The prediction is best
for those Running Index values that have been received at speed and running circumstances similar to the
target performance.
Running Index
Cooper test
(m)
5 km (h:m-
m:ss)
10 km (h:m-
m:ss)
21.098 km
(h:mm:ss)
42.195 km (h:m-
m:ss)
36 1800 0:36:20 1:15:10 2:48:00 5:43:00
38 1900 0:34:20 1:10:50 2:38:00 5:24:00
40 2000 0:32:20 1:07:00 2:29:30 5:06:00
42 2100 0:30:40 1:03:30 2:21:30 4:51:00
44 2200 0:29:10 1:00:20 2:14:30 4:37:00
46 2300 0:27:50 0:57:30 2:08:00 4:24:00
48 2400 0:26:30 0:55:00 2:02:00 4:12:00
50 2500 0:25:20 0:52:40 1:57:00 4:02:00
52 2600 0:24:20 0:50:30 1:52:00 3:52:00
54 2700 0:23:20 0:48:30 1:47:30 3:43:00
56 2800 0:22:30 0:46:40 1:43:30 3:35:00
58 2900 0:21:40 0:45:00 1:39:30 3:27:00
60 3000 0:20:50 0:43:20 1:36:00 3:20:00
62 3100 0:20:10 0:41:50 1:32:30 3:13:00
64 3200 0:19:30 0:40:30 1:29:30 3:07:00
66 3300 0:18:50 0:39:10 1:26:30 3:01:00
68 3350 0:18:20 0:38:00 1:24:00 2:55:00
70 3450 0:17:50 0:36:50 1:21:30 2:50:00
72 3550 0:17:10 0:35:50 1:19:00 2:45:00