


28
(ml/kg min)
60
54
48
42
36
30
24
18
12
6
0
(Age) 20s 30s 40s 50s 60s
(ml/kg min)
60
54
48
42
36
30
24
18
12
6
0
(Age) 20s 30s 40s 50s 60s
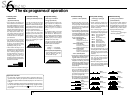
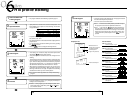
Aerobic power measurement (2)
Physical Fitness Level (PFL)
• There are five physical fitness levels: 1 ~ 5. These levels are relative
evaluations that compare your maximum oxygen uptake (MOU), esti-
mated by the aerobic power measurement program, with the values of
other people of the same age and sex (Physical Fitness Level Test Table).
• Ergociser™ EC-1600 stores the following physical fitness level test table,
which can be selected by the selector switch on the back panel of the con-
trol unit. (See page 9)
[American Males] [American Females]
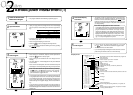
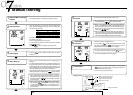
• In the Ergociser™ EC-1600 "Aerobic power measurement" program the
weight of the pedals are changed at 3 levels, and the pulse rate at the end
point of each level is measured. Based on the result, the relationship be-
tween the work rate (wattage) and the pulse rate is analyzed by linear
regression. Extend the regression line until reaching the maximum heart
rate (=204–0.69 x age) which is estimated by age. The work rate (wattage)
of this point becomes the maximum physical work capacity.
• PWC max. safely estimates how much exercise is possible at the limit of
physical work capacity, that is, at maximum heart rate without perform-
ing actual exercise.
Maximum Physical Work Capacity (PWC max.)
Maximum Oxygen Uptake (MOU)
• MOU is widely used as an index for total physical endurance. MOU indicates the
amount of oxygen one can intake at the limit of their physical work capacity. In
the Ergociser™ EC-1600, MOU is calculated based on the maximum physical
work capacity (PWC max.) explained below, assuming that
1 litre of oxygen corresponds to 5.0 Kcal, and
the human body efficiency rate for a bicycle exercise is 23%
25 50 75 100 125 150 (watt)
180
140
120
80
(bpm)
Maximum Physical Work CapacityWork Rate
Maximum Heart Rate
Heart Rate
Measurement
Estimate
Physical Fitness Level Test
Table by Maximum Oxygen
Uptake (MOU)
5: Excellent
4: Good
3: Average
2: Fair
1: Poor
MOU
MOU
29
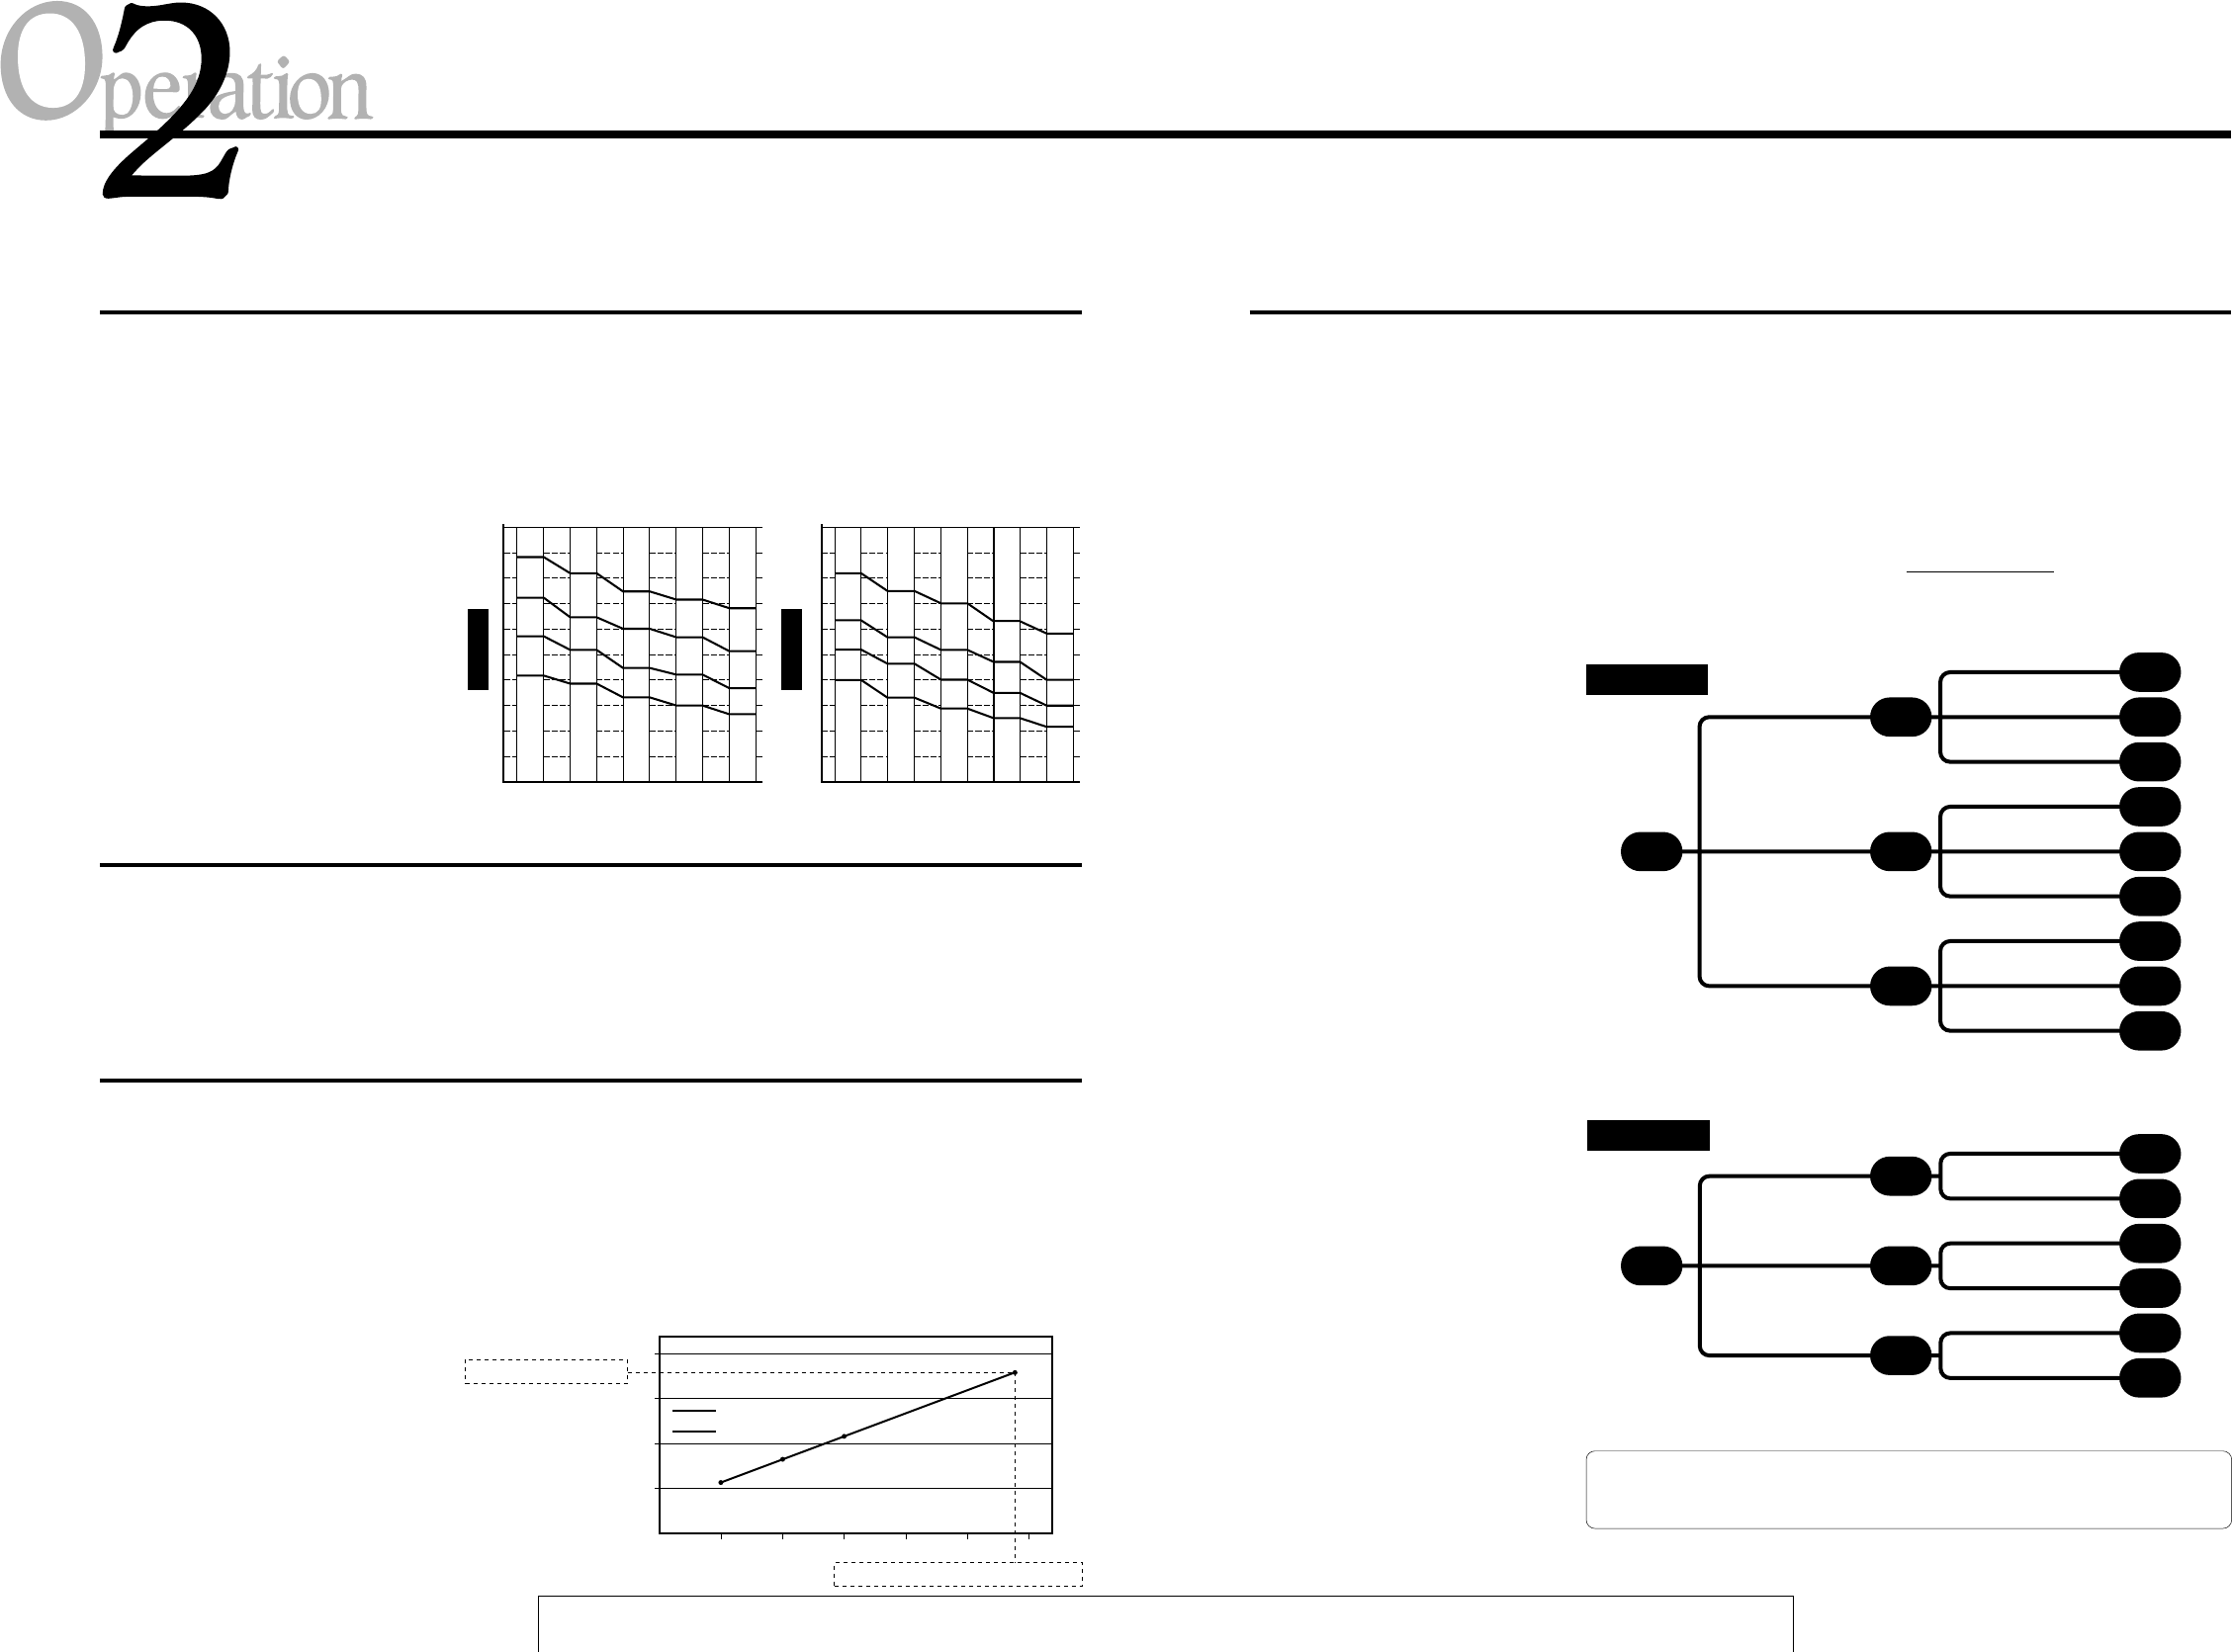
1.5 kg
1.8 kg
2.2 kg
2.2 kg
2.6 kg
3.0 kg
3.0 kg
3.3 kg
3.5 kg
1.2 kg
1.8 kg
2.5 kg
1.0 kg
1.1 kg
1.4 kg
1.5 kg
1.8 kg
1.8 kg
2.5 kg
0.8 kg
1.0 kg
1.5 kg
0.5 kg
Pulse≥135
120≤Pulse<135
Pulse<120
Pulse≥135
120≤Pulse<135
Pulse<120
Pulse≥135
120≤Pulse<135
Pulse<120
Pulse≥110
90≤Pulse<110
Pulse<90
Pulse≥123
Pulse<123
Pulse≥123
Pulse<123
Pulse≥123
Pulse<123
Pulse≥115
Pulse<95
95≤Pulse<115
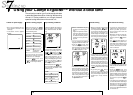
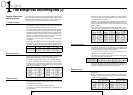
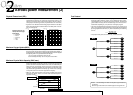
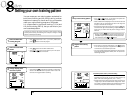
Test Protocol
• In the "Aerobic power measurement" program of the EC-1600, the
workload (pedal resistance: torque) for the subsequent stage is deter-
mined depending on your pulse rate at the previous stage. The workload
(pedal resistance: torque) will be increased along one of the routes illus-
trated below, depending on your pulse rate ™during the program.
• The pulse rates specified below represent the protocol for a person of 20
years. For the people over 20, the borderline of pulse rate will be adjusted
by the age adjustment coefficient (K), which is obtained by the following
formula:
204–0.69 x Age
204–0.69 x 20
• For people over 60 years, the coefficient (K) is calculated as 60.
K =
Remark: The load change for males over 50 years of age is the same as
for females.
When the age is less than 20, the load changes as if the age were 20.
Male
Female