14
T9600HRT FEEDBACK DISPLAY
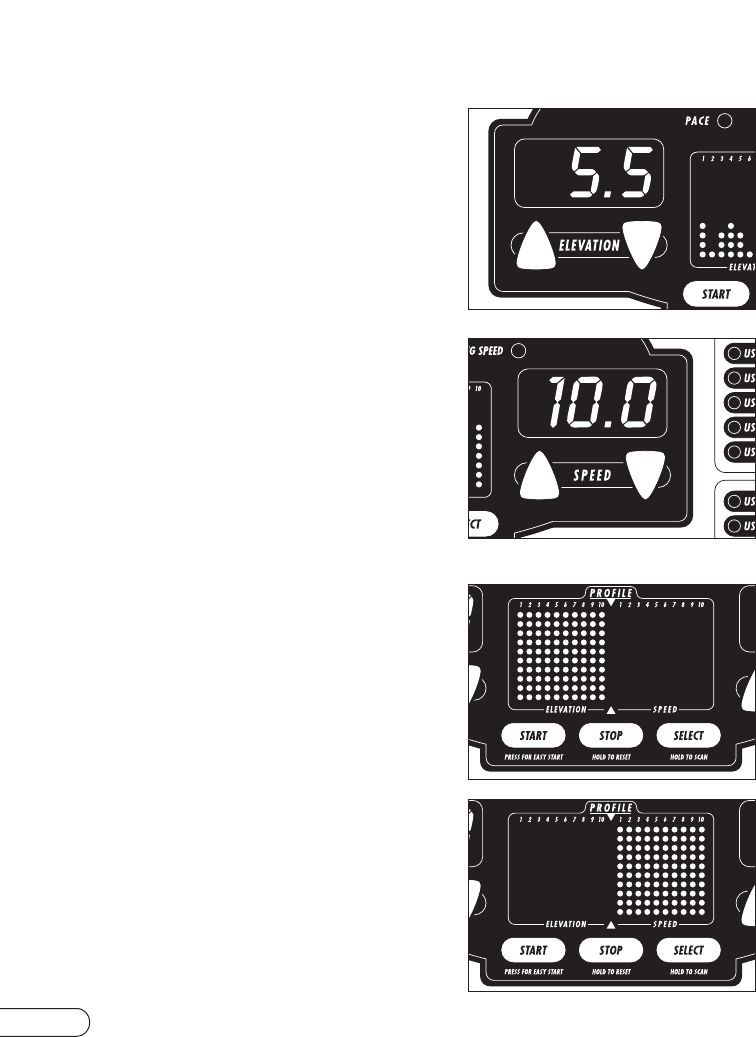
ELEVATION
Shown as percentage of incline,
Elevation is visible in the left-hand
LED window. Indicates how steeply
inclined the running surface is, to
simulate running on a hill.
SPEED
Shown as Miles/Hour, Speed is
visible in the right-hand LED
window. Indicates how fast the
running surface is moving, to
simulate outdoor running.
PROFILE MATRIX WINDOW 10 X 21
The Left dots #1-10 will show an
Elevation Profile in 10 segments in
ORANGE. This profile is not an
exact representation of the
elevation profile, but just a bar
graph.
The Right dots #1-10 will show a
Speed Profile in 10 segments in
RED. This profile is not an exact
representation of the speed profile,
but just a bar graph.
(continued on next page.)


