


147
Configuring Monitor Screen Settings
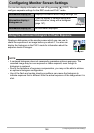
A histogram is a graph that represents the lightness of an image in terms of the
number of pixels. The vertical axis indicates the number of pixels, while the horizontal
axis indicates lightness. If the histogram appears too lopsided for some reason, you
can use EV shift to move it left or right in order to achieve better balance. Optimum
exposure can be achieved by EV shifting so the graph is as close to the center as
possible. For snapshots, you can even display individual histograms for R (red), G
(green), and B (blue).
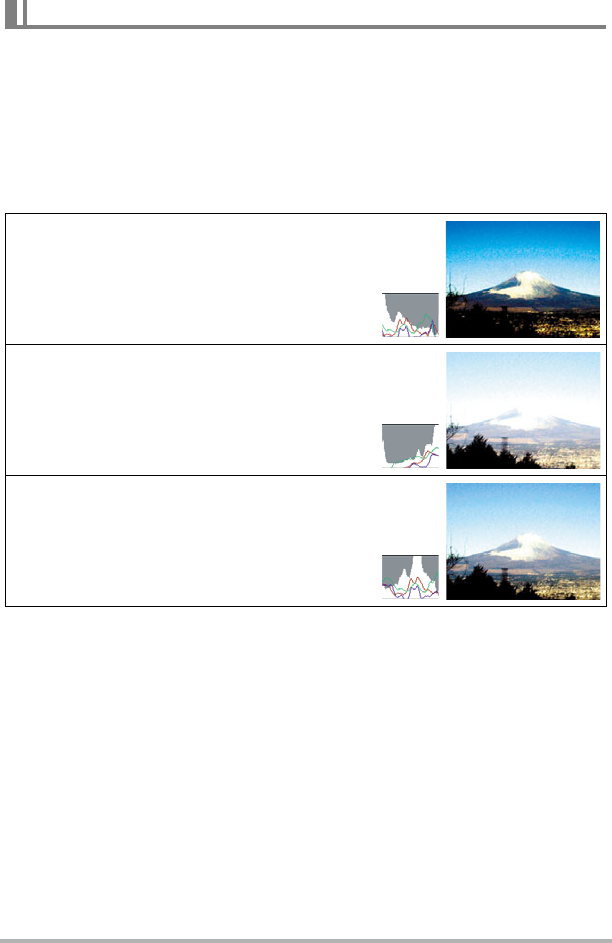
Example Histograms
How to Use the Histogram
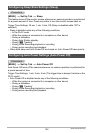
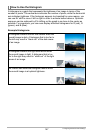
A histogram towards the left side results when the
overall image is dark. A histogram that is too far to
the left may result in “black out” of the dark areas
of an image.
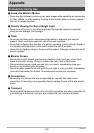
A histogram towards the right side results when
the overall image is light. A histogram that is too
far to the right may result in “white out” of the light
areas of an image.
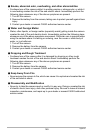
An overall well-balanced histogram results when
the overall image is at optimal lightness.