


22
e-Train Data™
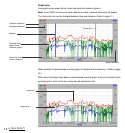
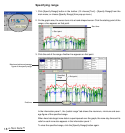
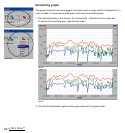
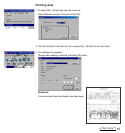
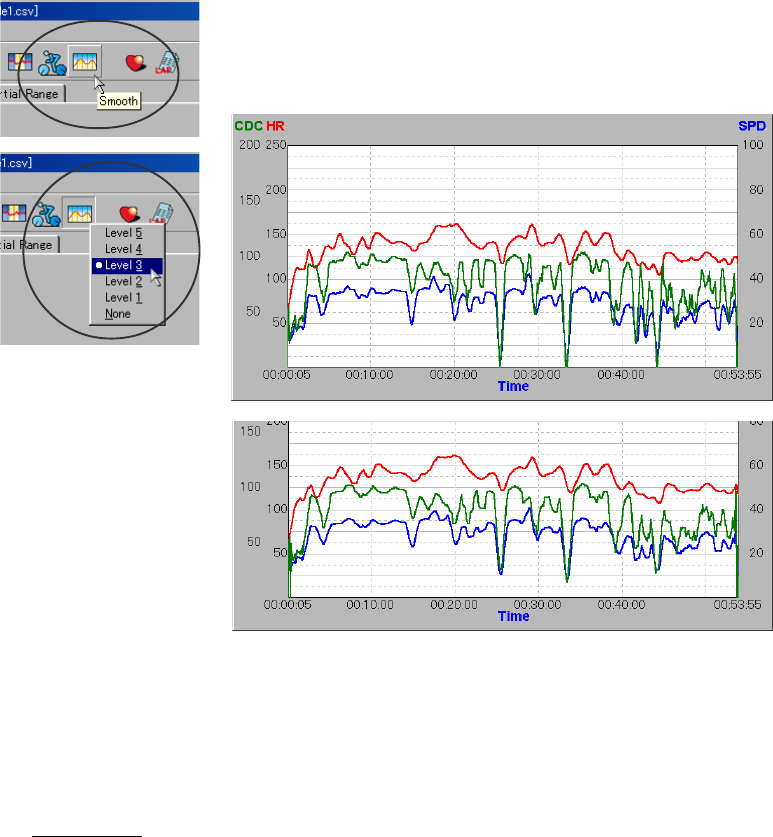
Smoothing graph
The graph line tends to be more jagged if the data covers a longer period of elapsed time. In
order to make it a more easy-to-read graph, there are five smoothing levels.
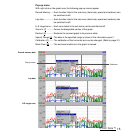
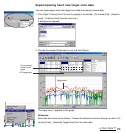
1. Click [Smooth] button in the tool bar. (Or choose [Edit] – [Smooth] from the menu bar.)
To choose the smoothing level, right-click the button.
2. Click the [Smooth] button again and the graph returns to the original state.
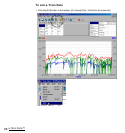
Level 3
Level 5
right-click