


e-Train Data™
19
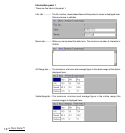
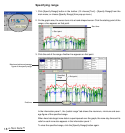
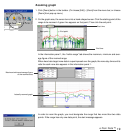
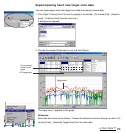
Zooming graph
1. Click [Zoom] button in the toolbar. (Or choose [Edit] – [Zoom] from the menu bar; or choose
[Zoom] from pop-up menu.)
2. On the graph area, the cursor turns into a hand-shaped cursor. Click the starting point of the
range to be zoomed. A green line appears on that point. Then click the end point.
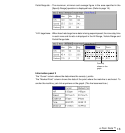
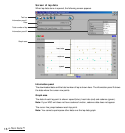
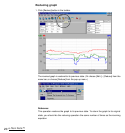
In the information panel 1, the “visible range” tab shows the maximum, minimum and aver-
age figure of the zoomed range.
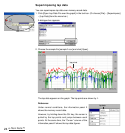
When heart rate target zone data is superimposed over the graph, the zone stay time and its
ratio for each zone also appears in the information panel 1.
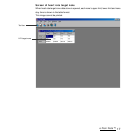
In order to zoom the graph, you must designate the range that has more than two data
points. If the range has only one data point, the alert message appears.
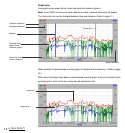
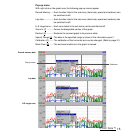
Start point→←End point
Maximum/minimum/average figure
of the zoomed area
Start time
Laterally-zoomed graph
End time