


14
e-Train Data™
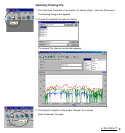
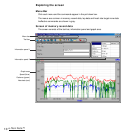
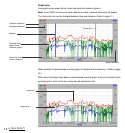
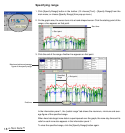
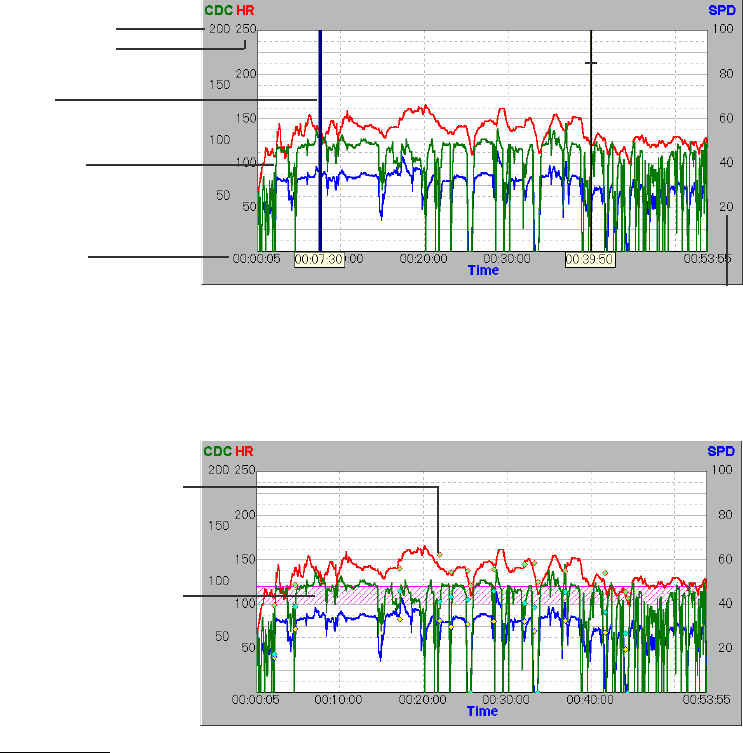
Graph area
Line-graph shows speed (blue), heart rate (red) and cadence (green).
Note: If your MSC-unit does not have cadence function, cadence data does not appear.
The horizontal axis can be changed between time and distance. (Refer to page 11.)
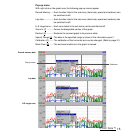
Cadence calibration
Heartrate calibration
Speed calibration
Markline
Heartrate (red)
Speed (blue)
Cadence (green)
When lap data is superimposed over the graph, the lap points are shown by ◊. (Refer to page
24.)
When heart rate target zone data is superimposed over the graph, the zone is shown by the
colored section. Each of the four zones can be switched on/off.
Cursor line→
target zone 1
lap points
Horizontal Axis
(time or distance)