First Edition Dated September, 2000 31
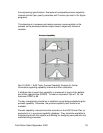
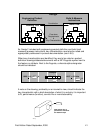
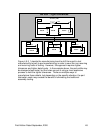
test should confirm that parts combined on a single control chart exhibit
similar variability.
6.4 Process Control, Capability and Variation
Reduction
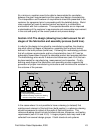
Section 4.3 Key Characteristic Process Control and
Capability Requirements
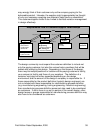
Once key characteristics have been identified and documented, variation
control and reduction techniques must be applied to those key characteristics.
Processes are optimized through reduction of both special and common
cause variation. Statistical control charts are used to identify special causes
of variation.
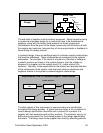
Measurement system analyses, cause and effect diagrams and statistically
designed experiments are commonly used tools to identify and reduce
common cause variation.
If statistical process control is chosen as the method of control
for the key characteristic in 4.2.2 above, the following
requirements must be met:
Section 4.3.1 When a key characteristic is not in statistical
control, the out-of-control condition shall be investigated for
special causes of variation, and corrective action taken to
permanently remove or minimize special causes of variation.
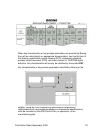
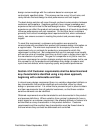
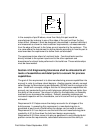
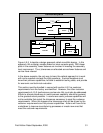
A process is considered out of control when nonrandom behavior is present in
the process. This behavior is evidenced on a control chart when nonrandom
patterns occur (e.g., points beyond the control limits, cycles, trends or shifts).
Points beyond the statistical control limits must be investigated for assignable
causes of variation. (See D1-9000-1, AQS Tools, "Interpretation of Control
Charts").
If an out-of-control condition arises, the question “What has changed?” should
be asked. A control chart tells where and when the change took place, but not
why. If reasons can be assigned to these special causes of variation, then
they can be designated as “assignable.”