First Edition Dated September, 2000 25
Regardless of the method chosen for variation control, measurements should
show that the method does control variation in the process and should
provide assurance that the process is repeatable and error-free.
If methods of control other than statistical control charts are used, then once
stability and capability are established, measurement should still be made
periodically to ensure that stability and capability have been retained.
The measurement system that provides the data should also be suitable for
the measurements taken. A variation study to determine the capability and
repeatability of the measurement system, including both the gage and the
users, should be performed to ensure that the variation in the measurements
is due mostly to variation in the part and not in the measurement process
itself. The percent tolerance consumed by the measurement system should
be in the neighborhood of 10%, and certainly no more than 30%. The gage
should also be selected to yield adequate measurement resolution.
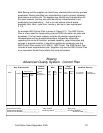
Methods of Variation Control of Key Characteristics
The following is a selection of tools that might be used to control variation on
a key characteristic. Details on applying these tools are found in D1-9000-1,
AQS Tools.
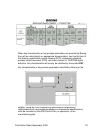
Statistical process control
Statistical process control (SPC) is a systematic method for measuring,
graphing, tracking, and managing variation.
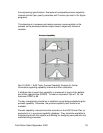
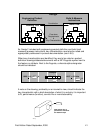
The use of statistical process control charts and the indicated actions taken
help ensure that special causes of variation are identified and eliminated and
that the process is stable and predictable. Statistical control charts are an
important tool to help the user identify when a process has changed.
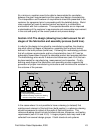
Capability analyses, along with statistical control charts, help ensure that the
process is consistently producing product close to target with minimum
variability. Capability analyses can, after a process is stabilized, reduce
common cause variation so products not only meet engineering
specifications, but also attain a level of minimum variation that is economically
beneficial. Tools to reduce common cause variation include brainstorming,
cause and effect diagramming, structure tree diagramming, DOE, process
flowcharting and redesign, and problem solving – see D1-9000-1, AQS Tools.
Note: Statistical process control charts in themselves do not control
processes. They provide information so process owners can make process
improvements.