


25
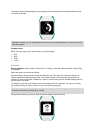
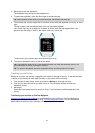
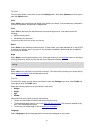
This graph, shown above, is a heart rate zone summary. It shows the percentage of time spent in each
zone with your current zone highlighted in white.
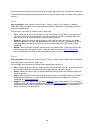
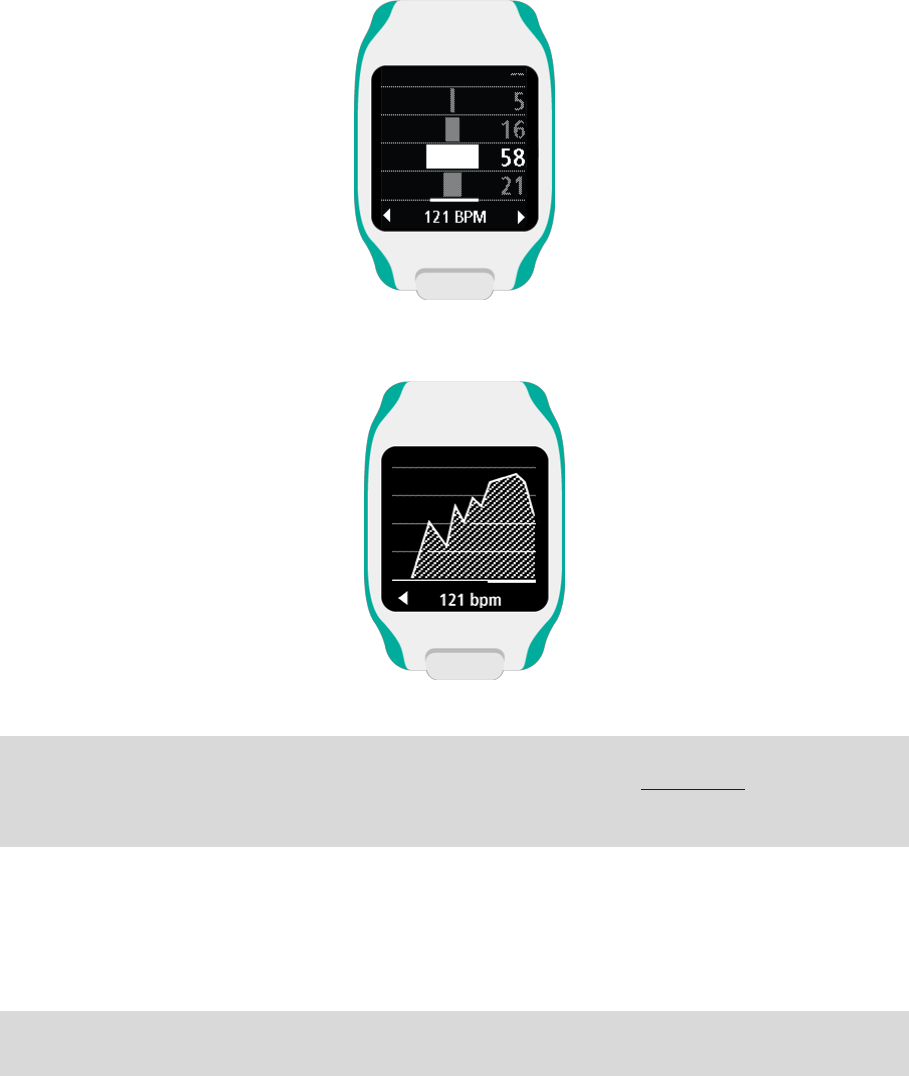
This graph shows your heart rate over the last 2.5 minutes of activity.
Tip: You can view your progress in a heart rate zone even when you are using a Graphical Training
Partner like Race or Goal. During training, from the screen showing a main metric, move right to
see the graphical training screen. Move down to see the heart rate zone screens as described
above.
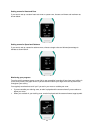
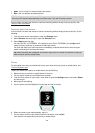
Race
How to get there: Activity screen > Move Down > Training > Race> Recent or MySports.
Select this option to race against one of your ten most recent activities or race against an activity from
the MySports website.
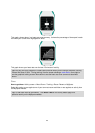
Tip: To add more races to the website, click RACE THIS on the activity details page for a
particular activity on the MySports website.