17
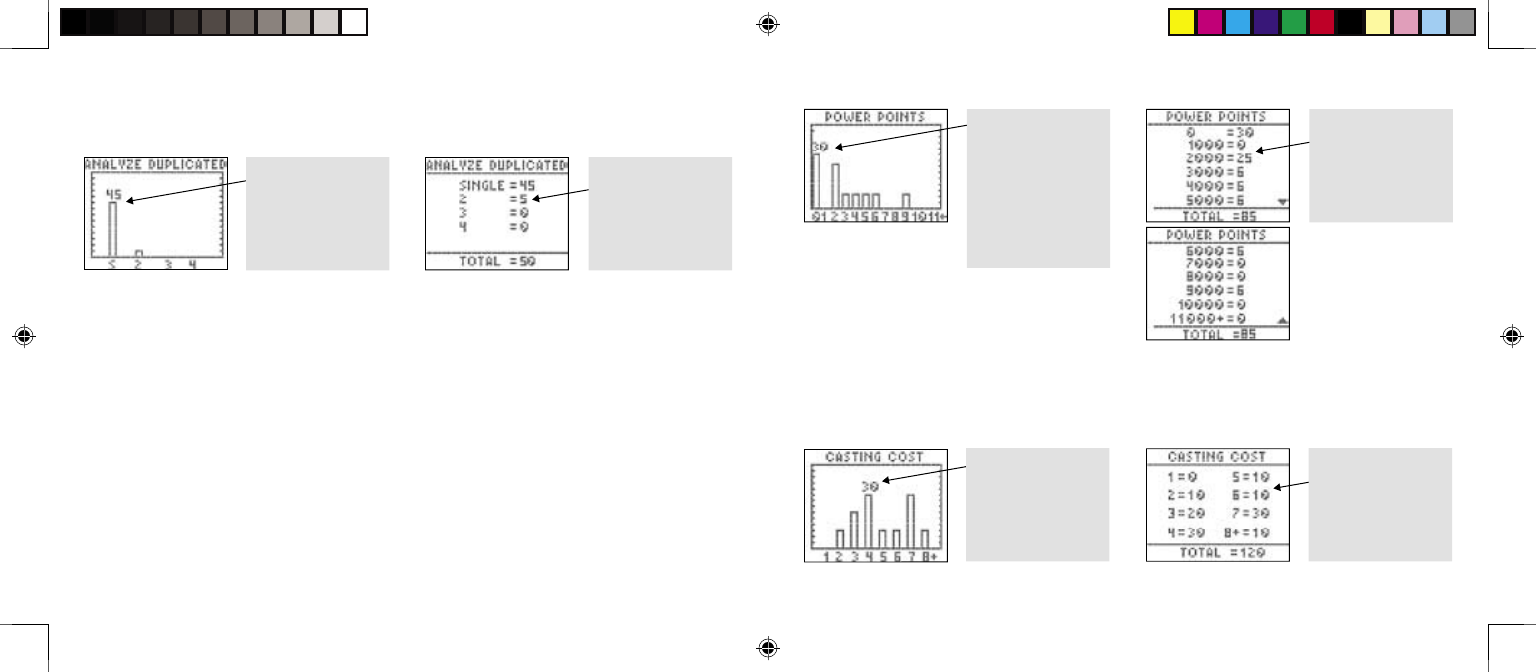
Duplicated Cards: When this option is selected, the DEX lists how many single cards, duplicates,
triplicates, etc. you have in a deck.
Following are examples of the “Duplicated Cards” screens.
Graphics Chart
Table Chart
Power Points: When this option is selected, the DEX counts and sorts the cards based on their
Power Point value. Power Points range from 0 to 11,000
+
.
Note: The charts round-off power point totals in 1000-point increments. If a card has a power
point of 2500, it will be listed in the 2000 list.
Following are examples of the “Power Point” screens.
Graphics Chart
Table Chart
Casting Cost: When this option is selected, the DEX counts and sorts the cards by the Casting
Cost located in the upper left hand corner of the card. The Casting Costs range from “1 to 8
+”
.
Following are examples of the “Casting Cost” screens.
Graphics Chart
Table Chart
18
In the graphics chart.
bars illustrate that
there are 45 single
cards, and fewer
duplicates, triplicates,
etc. in this deck.
In the table chart,
the exact number of
each type of card is
shown.
In the graphics chart,
bars illustrate that
there are 30 cards with
a power of 0 points.
There are fewer with
1,000, 2,000, 3,000
etc. points. Press the
SCREEN SCROLL
PAD to the right
and left to view the
entire chart.
In the table chart, the
number of cards with
each Power Point
amount is shown.
In the graphics chart, bars
illustrate that there are
30 cards with a Casting
Cost of 4. There are
fewer cards with higher
Casting Costs. Press the
SCREEN SCROLL PAD
to the right and left to view
the entire chart.
In the table chart, the
number of cards with
each Casting Cost is
shown.
DM_420470000IWHB-01_INS 9/14/04, 3:27 PM18-19


