


E-78
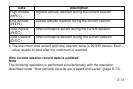
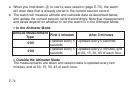
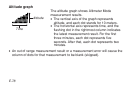
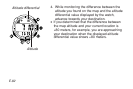
Altitude graph
The altitude graph shows Altimeter Mode
measurement results.
• The vertical axis of the graph represents
altitude, and each dot stands for 10 meters.
• The horizontal axis represents time, and the
flashing dot in the rightmost column indicates
the latest measurement result. For the first
three minutes, each dot represents five
seconds. After that, each dot represents two
minutes.
• An out of range measurement result or a measurement error will cause the
column of dots for that measurement to be blank (skipped).
Time
Altitude