


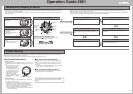

Operation Guide 2891
10
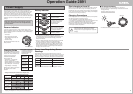
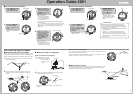
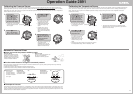
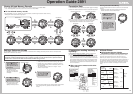
Interpreting the Pressure Tendency Graph
Example Pressure Tendency Graphs
The following examples show how you can predict upcoming
weather conditions based on the pressure tendency graph. When
using the pressure tendency graph, remember that changes in
your altitude and environmental conditions can affect air pressure
and show up as changes on the pressure tendency graph.
• Continual rise in barometric pressure
Rising barometric pressure indicates that upcoming weather will
be fair.
• Continual drop in barometric pressure
Falling barometric pressure indicates that upcoming weather will
deteriorate.
• Temperature and humidity can affect pressure graph contents.
Because of this, pressure tendency graph contents are intended
for reference only.
• The watch will not take a barometric pressure reading if a
measurement time arrives while the barometric pressure sensor is
malfunctioning, while rechargeable battery power is low, or while
the watch is in the function sleep state.
❚
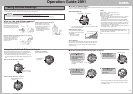
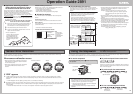
To take pressure and temperature readings
In the Timekeeping Mode, Compass Mode, or Altitude Mode, press the B button to enter the Pressure/Temperature Mode. The display will
show the barometric pressure and pressure tendency graph, and temperature.
Barometric Pressure
Measurement Range: 260hPa to 1,100hPa
Measurement Unit: 1hPa
• The display will show “– – – –” whenever a measured value is
outside the measurement range.
Temperature
Measurement Range: –10.0
o
C to 60.0
o
C
Measurement Unit: 0.1
o
C
• For a temperature of –10
o
C, the displayed temperature shows
–10
o
C (not –10.0
o
C).
• The display will show “– – –” whenever a measured value is
outside the measurement range.
Pressure Tendency Graph
The pressure tendency graph shows the results of barometric
pressure readings that are taken automatically every two hours.
If you do not perform any button operation for two or three
minutes while in the Pressure/Temperature Mode, the watch
will return to the Timekeeping Mode automatically.
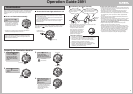
Pressure/Temperature Mode Display
Pressure Tendency Graph
Pressure
Temperature
Pressure
Differential
Graph
• The barometric pressure can take up to four or five seconds to
appear after you enter the Pressure/Temperature Mode.
Barometric Pressure and Temperature Readings
After you enter the Pressure/Temperature Mode, the watch takes
readings every five seconds for three minutes. After that, the
watch will take a reading whenever you press the B button.
• When measuring outdoor temperatures, remove the watch from
your wrist and place it in a location where its readings will not
affected by body temperature, sweat (water droplets), direct
sunlight, etc.
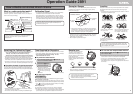
❚
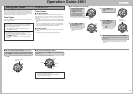
To turn the pressure differential graphic
on and off
1. In the Pressure/
Temperature Mode, hold
down the
EE
EE
E button for
about two seconds until
“SET” appears at the top
of the display.
• After about four or five
seconds, the barometric
pressure value will appear in
the middle of the display.
2. Press the
DD
DD
D button twice
to move the flashing to the
pressure differential
graphic On/OFF setting.
3. Press the
CC
CC
C button to
toggle the setting on
(display graphic) and off
(do not display graphic).
4. Press the
EE
EE
E button to exit
the setting screen and
return to the Pressure/
Temperature Mode screen.
• The watch automatically exits the pressure differential graphic on/
off setting screen if you do not perform any operation for about
two or three minutes.
Te mperature
Pressure
(2 seconds)
(Twice)
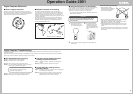
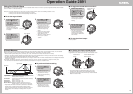
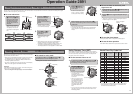
Interpreting the Pressure
Differential Graphic
The pressure differential graphic shows the relative difference
between the barometric pressure reading taken when you enter
the Pressure/Temperature Mode and the last of the readings the
watch takes every two hours.
• The graphic shows changes up to ±15hPa, in 1hPa units.
• You can turn display of the pressure differential graphic off, if you
want.
Example 1: Temperature differential = –5hPa
+15hPa
–15hPa
±0hPa
Data used for
comparison
Pressure Differential Graphic (–5hPa)
Example 2: Temperature differential = +15hPa
Pressure Differential Graphic (+15hPa)
In excess of ±15hPa
Graphic displayed at 9 o’clock
Indicator appears
at 9 o’clock
• The graphic does not appear when the barometric pressure
reading is outside the measurement range (260 to 1100hPa).
Taking Pressure and Temperature Readings
The pressure tendency graph shows 30 hours (16 readings) of
barometric pressure readings that are taken automatically by the
watch.
• A plot on the graph indicates the relative change from one reading
to the next. Each level represents a relative change of 1hPa.
The pressure tendency graph is mainly for tracing changes in
barometric pressure, which can be used to predict upcoming
weather.
A plot may be skipped because it is outside the range of the
currently displayed graph when the change between readings
is extremely large due to movement between different
altitudes, an extreme change in weather, an extreme change
in temperature, etc. If the next plot is near the reading that is
outside the range of the current graph, the graph will shift to
show both of the plots.
Not visible