


2172-6
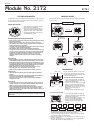
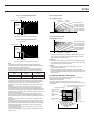
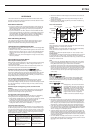
As can be expected according to the nitrogen uptake characteristics
illustrated in Figure 1, the left side of the graph climbs steeply when
submersing, with the upward slope flattening out as you move to the right.
Conversely, the left side of the graph when surfacing drops steeply and
flattens out as you move to the right, as indicated by the nitrogen elimination
characteristics illustrated in Figure 2.
Super Saturation and Non-decompression Diving
Nitrogen dissolved in blood and tissue remains in
the body of the diver after the dive is complete, as
indicated by the dark segments on the graph. When
the pressure of the dissolved nitrogen is higher than
the pressure of the gas at one atmosphere (ambient
pressure), it creates an unstable situation known as
“super saturation.”
The human body is able to withstand a certain
degree of super saturation. Fast tissue (short
halftime) is able to withstand super saturation best,
while slow tissue less able to withstand super
saturation.
Any dive in which the super saturation limit of the
human body is not exceeded is called a “non-
decompression” dive.
This side rises steeply
when submersing.
This side drops steeply
when surfacing.
The slope on this side
both while submersing
and surfacing is very
gentle.
The markers change position as
the depth of the dive changes.
Fast tissue is able to
withstand super
saturation best.
Slow tissue is less able
to withstand super
saturation.
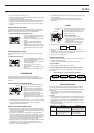
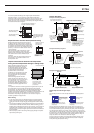
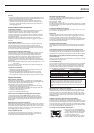
Important Precautions about Non-decompression
Diving and the Compartment Nitrogen Loading Graph
Super saturation nitrogen levels for each
halftime tissue compartment, as well as
the boundary between non-decompres-
sion diving and decompression diving are
all greatly influenced by individual
physical condition, environmental
conditions, etc. Consequently, this watch
does not define the boundary between
non-decompression diving and decom-
pression diving.
Standard diving computers and dive
tables normally set the boundary from a
point around three to four times sea level,
to a point around 1.5 to 1.8 times sea
level for slow tissue. Applying this to the
Compartment Nitrogen Loading Graph of
this watch produces a graph like the one
nearby.
It is important to note that the above graph does not guarantee that you can
dive safely within the area marked non-decompression diving without
decompression. The boundary between non-decompression diving and
decompression diving are all greatly influenced by individual physical
condition, environmental conditions, etc. In addition, the data produced on the
graph of this watch does not take factors such as rate of ascent into
consideration. Ascending too quickly from a dive creates a dangerous
situation regardless of nitrogen levels.
Nitrox Diving
• In the case of nitrox diving, the boundary between non-decompression
diving and decompression diving must be shifted upwards because the
nitrox gas mixture has a higher oxygen percentage than found in ordinary
air.
• The Compartment Nitrogen Loading Graph assumes that you are breathing
normal air both underwater and on the surface. With nitrox diving, you are
breathing nitrox underwater and normal air on the surface, to the accuracy of
simulations tends to deteriorate as the number of repeat dives increases.
With nitrox diving, the actual nitrogen uptake level is less than that indicated
by the simulation.
• Never attempt to perform nitrox diving without going through the required
special safety training first.
The boundary shown
here is one example
intended for reference
purposes only.
Decompression dive
Non-decompression dive
Display Examples
Example 1: Relatively Deep Dive
Example 2: Relatively Long Dive
Nitrogen uptake continues in the direction of the
nitrogen component pressure for normal air.
Depth
30m
15m
5m
Dive time
A short ascent causes elimination
at the 5-minute compartment only.
Gradually
approaches
saturation.
Nitrogen component
pressure correspond-
ing to current depth.
Dive has not started yet, so there
is almost new nitrogen uptake.
Rapid nitrogen
uptake
Nitrogen
component
pressure at
current depth
Details
The tissue nitrogen uptake level
rises and falls to equilibrate with
nitrogen component pressure
at the current depth.
The speed of change is faster on
the left side of the graph and
slower on the right side.
Nitrogen level rises
Nitrogen level drops
Nitrogen uptake continues in
the direction of the nitrogen
component pressure for
normal air.
Nitrogen is slowly
eliminated in the
direction of the
nitrogen component
pressure for
5 meters.
Depth
Dive time
Rapid nitrogen uptake
Dive has not
started yet, so
there is almost
new nitrogen
uptake.
Uptake continues very gradually.
Gradually approaches saturation.
Nitrogen uptake continues
in the direction of the nitrogen
component pressure for normal air.
Nitrogen is slowly
eliminated in the direction
of the nitrogen component
pressure for 5 meters.
20m
5m
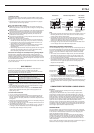
Example 3: Surface Interval Time
Depth
Time
Dive ends
Surface interval
Immediately
prior to dive end
One hour later
Three hours later
Dive
Nitrogen is eliminated from fast
tissue (with short halftime) quickly.
Nitrogen is eliminated from slow
tissue (with long halftime) slowly.
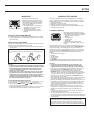
Safety Stops and the Nitrogen Graph
Note
The boundary shown here is an example intended for reference purposes
only.
Diving to relatively deep depths causes a large volume of nitrogen to be
dissolved quickly into fast tissue, which means that the non-decompression
limit is reached relatively quickly. Surfacing too quickly even when diving at
non-decompression depths, for example, does not provide a margin of error
(above graph on the left). Normally, a safety stop of about five minutes should
be taken even for non-decompression diving at relatively shallow depths of
around five meters. A safety stop of only five minutes provides a margin of
safety that allows even slow tissue to eliminate nitrogen.
All of this means that surfacing too quickly without allowing nitrogen to be
dissipated properly is dangerous, and staged decompression is required
when performing decompression diving.
Nitrogen uptake volume that allows
a margin of safety (surfacing with
safety stops)
Approaching too close
to the boundary does
not allow a margin of
safety.
Nitrogen uptake volume close to
boundary value (surfacing without
safety stops)
Allows a margin
of safety.