


2172-5
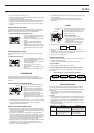
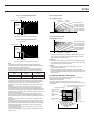
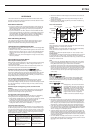
Figure 1: Tissue Nitrogen Uptake Graph
Saturation Value
Halftime (Saturation)
Nitrogen level
Half the time it takes to achieve maximum saturation.
Time
Figure 2: Tissue Nitrogen Elimination Graph
Saturation
half value
Half the time it takes to achieve elimination of nitrogen.
Saturation Value
Halftime (Saturation)
Nitrogen level
Time
Saturation
half value
Note
The solubility of blood and other bodily fluids is directly proportional to
ambient pressure. When diving, the nitrogen uptake of the body’s tissues is
also directly proportional to ambient pressure.
Normally, tissue nitrogen uptake is expressed in terms of the pressure of
nitrogen, or nitrogen component pressure. The atmospheric pressures of
nitrogen and oxygen are proportional at a ratio of 8-to-2 as shown below.
atm = atmospheres
This nitrogen component pressure corresponds to the nitrogen component
pressure in the air we breathe, and nitrogen is dissolved into body tissue in
accordance with the graph in Figure 1, until it ultimately reaches the
saturation level for the nitrogen component pressure value of the air being
breathed.
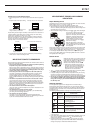
How nitrogen is dissolved into and eliminated from human tissue is very
different depending on the type of the tissue in question. Highly vascular
tissue (tissue that contains many blood vessels) tends to absorb nitrogen at a
faster rate while submersing and to eliminate it more quickly when the diver
surfaces, and so it is called “fast tissue.” Fast tissue also has a relatively high
tolerance for excess nitrogen.
As can be expected from the above, tissue that is less vascular is “slow
tissue,” because it is slower to absorb nitrogen under high pressure and to
eliminate it at lower pressure, and it has a relatively low tolerance for excess
nitrogen.
All of this means that fast tissue has a short halftime and slow tissue has a
long halftime.
Of course, the human body is composed of various types of tissues, ranging
from the fastest to the slowest, with variations in between. That is why the
body is divided into a number of theoretical “compartments” that are assigned
halftimes for nitrogen uptake and elimination values for the purposes of
calculating decompression.
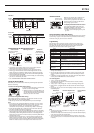
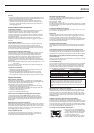
This watch uses nine compartments with halftimes of 5, 10, 20, 40, 60, 80,
120, 240, and 320 minutes.
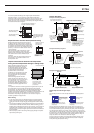
Figures 3 and 4 below illustrate nitrogen uptake and elimination for each of
these nine times.
Nitrogen Component
Pressure
0.8 atm
1.6 atm
Oxygen Component
Pressure
0.2 atm
0.4 atm
Depth
Sea level (1 atm)
10 meters (2 atm)
Tissue Nitrogen Pressure
5-minute
compartment
10-minute
compartment
20-minute compartment
40-minute compartment
60-minute compartment
80-minute compartment
120-minute compartment
240-minute compartment
320-minute compartment
Figure 3: Nitrogen Uptake
Figure 4: Nitrogen Elimination
• This watch incorporates the latest thinking on decompression theory that
uses a safety factor to adjusts nitrogen elimination halftimes so they are
relatively longer than uptake halftimes.
Important!
• It should be noted there that tissue compartments are theoretical divisions
for calculating estimated nitrogen uptake and elimination. They do not refer
to any specific organs within the human body.
Time
Tissue Nitrogen Pressure
5-minute
compartment
10-minute
compartment
20-minute compartment
40-minute compartment
60-minute compartment
80-minute compartment
120-minute compartment
240-minute compartment
320-minute compartment
Time
Caution!
• The Compartment Nitrogen Graph of this watch does not show non-
decompression pressure limits.
• Compartment Nitrogen Graph data is based on numeric calculations
performed using depth, dive time, and halftime. Always keep in mind that it
shows theoretical representations of the levels of nitrogen contained in the
body of the diver.
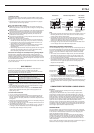
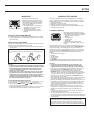
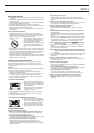
Compartment Nitrogen Loading Graph
This section explains the information that appears on the Compartment
Nitrogen Loading Graph and how to interpret it.
Horizontal Axis: Compartments
Vertical Axis: Nitrogen level (relative pressure when sea level = 1)
In the Diving Mode, the two dot segments on the left indicate pressure at the
current depth.
PN2 (i): Tissue compartment nitrogen level (pressure)
(Relative pressure when sea level = 1)
4.0 PN2 (i)
3.0 PN2 (i)<4.0
2.8 PN2 (i)<3.0
2.6 PN2 (i)<2.8
2.4 PN2 (i)<2.6
2.2 PN2 (i)<2.4
2.0 PN2 (i)<2.2
1.8 PN2 (i)<2.0
1.6 PN2 (i)<1.8
1.4 PN2 (i)<1.6
1.2 PN2 (i)<1.4
1.05 PN2 (i)<1.2
Not shown – PN2 (i)<1.05
Halftime Compartments
5-minute
10-minute
20-minute
40-minute
60-minute
80-minute
120-minute
240-minute
320-minute
Sea level nitrogen
level × 4
Sea level nitrogen
level × 3
Sea level nitrogen
level × 2
Sea level nitrogen
level
Pressure at current depth