


2172-4
To delete log data
Holding down A for about two seconds in the Recall Mode or Dive Profile
Mode deletes all the log data and dive profile data for the currently displayed
record.
• Deleting log data while a surface interval timing operation is in progress
stops the surface interval timing operation.
Using Log Data with Dive Tables
■ Make sure you have a clear understanding of dive tables and their use.
Before using this watch, make sure you have undergone a thorough diving
training program.
■ Make sure you have a clear understanding of the special characteristics of
all the log data provided by this watch (dive time, maximum depth, dive
start time, dive end time, average depth, maximum depth temperature).
■ Always remember that depth readings provided by this watch are not
guaranteed for 100% accuracy.
■ Any log data accompanied by a warning indicator should not be used. For
details, see “Warning Indicators”.
■ Always obey the basic rules of safe diving.
• It is recommended to dive within the limits of the non-decompression
limit. Be sure to take “safety stops” every 3 to 6 meters (10 to 20 feet).
• It is dangerous to dive near the non-decompression limit. Dive 1 to 2
ranks inside of your own personal limitations.
• No dive table is 100% accurate. You should always take into account
individual physical differences, your physical condition, water
temperature, etc.
• Note that high altitude and fresh water diving requires the use of special
dive tables and calculations. Be sure to receive appropriate training
before attempting high altitude or fresh water diving.
Calculation of Average Air Consumption Using Average Depth
Average depth is calculated by adding all depth readings greater than 1
meter (4 feet) and dividing the total by the number of readings taken. Since
readings at depths less than 1 meter (4 feet) are ignored, you will not be able
to use average depth log data to calculate average air consumption if tank air
is consumed while on the surface.
You should also note here that time you spend on the surface is not included
as part of the dive time.
DIVE PROFILE
When you exit the Diving Mode after a valid dive, the watch stores the
following Dive Profile data in memory, in addition to the log data.
As its name suggests, Dive Profile data provides a record of the maximum
depth reached during each minute of a valid dive.
• The depth readings of the Dive Profile are used to generate a Dive Profile
Graph.
• Dive Profile data memory allows up to 100 minutes duration for a single
dive, and can store data for up to 20 dives.
• No more profile data is stored in memory after the RECOVER or BATT
indicator (which indicates that battery power is weak) appears on the
display during a dive.
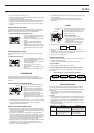
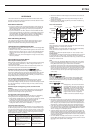
To recall Dive Profile data
1. Use C to enter the Dive Profile Mode.
• At this time, the Date screen for the log data that was displayed the last
time you exited the Recall Mode appears on the display for about three
seconds. After that, the display switches to the Maximum Depth screen for
that log data.
• Pressing A while the Maximum Depth screen is on the display changes to
the Date screen for about three seconds.
2. Use D (new ➞ old) and B (old ➞ new) to display the Date screen of the
Dive Profile data you want to view.
3. While the Maximum Depth screen is on the display, use D (+) and B (–)
to change to the Dive Profile Data screen and scroll through the Dive
Profile data (depth readings) minute-by-minute.
Description
• This time indicates the minute from the start of the dive
for whose depth reading is on the display.
• Elapsed time is recorded as hours and minutes.
• Maximum depth reached during the minute indicated by
the elapsed time reading.
Item
Elapsed Time
Depth Readings
Note
• When there are profiles for fewer than 20 dives in Dive Profile memory, the
Remaining Record screen, which shows the current number of unused
records, appears after the oldest record.
• Pressing B and D at the same time while the Date screen is on the
display jumps to the Date screen for the newest log data. The Date screen
remains on the display for about three seconds. After that, the display
switches to the Maximum Depth screen for that log data.
• Pressing B and D at the same time while the Dive Provide Data screen
is on the display returns to the Maximum Depth screen.
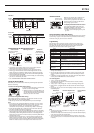
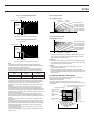
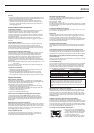
Interpreting the Dive Profile Graph
The Dive Profile Graph assigns a value of 10 to the maximum depth value of
the currently selected log data, and then plots all other depths relative to the
maximum. The appearance of the Dive Profile Graph depends on whether
you are viewing it on the Maximum Depth screen or the Dive Profile Data
screen.
• On the Date screen and Maximum Depth screen, the Dive Profile Graph
shows data from the beginning of the dive up to the 50th minute of the
dive, in five-minute intervals. The maximum depth reached during each
five-minute interval is used for graphing.
• On the Dive Profile Data screen, the Dive Profile Graph shows data from
the beginning of the dive up to the 100th minute of the dive, in one-minute
intervals. The bar in the graph that represents the currently displayed
elapsed time minute flashes.
x
10 58
11 58
3
82
500
100
50
2
500
001
25
100
Dive start time
Dive end time
Dive date
Dive time
Maximum depth
of selected dive
Elapsed time
Date Screen Maximum Depth Screen Dive Profile
Data Screen
3 seconds
➞
Maximum depth during
minute indicated by
elapsed time
Dive
Profile Graph
Dive
Profile Graph
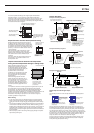
• Dive Profile data past the 50th minute of the dive is not shown on the Dive
Profile Graph of the Date screen and Maximum Depth screen.
• If the maximum depth of a dive exceeds 80 meters (263 feet), graph data
will go past the maximum depth boundary line.
• Dive Profile data (including the Dive Profile graph) is deleted whenever you
use the procedure under “To delete log data” to delete the corresponding
log data.
Dive Profile screenDate/Maximum depth screen
500 100
Maximum depth
boundary line
Maximum depth
boundary line
COMPARTMENT NITROGEN LOADING GRAPH
Important!
• Be sure to read this section carefully before using the Compartment
Nitrogen Loading Graph.
During a dive, the diver breathes air (or some mixture of gasses) that is
pressurized in accordance with the dive depth. Breathing air or other gas
while the body is under pressure causes gas to be dissolved into the body’s
blood and tissues. The deeper the dive (and the greater the pressure) and
the longer the dive, the greater the uptake of gas into the body’s tissue. In
dives that use air or nitrox (a mixture of nitrogen and oxygen), tissue nitrogen
uptake can cause a painful condition called “decompression sickness
syndrome” (DCS). To protect against DCS the prudent diver must formulate
and follow a diving plan that takes tissue nitrogen uptake and elimination into
consideration. This watch displays a graph of reference data that shows the
tissue nitrogen uptake based on compression theory.
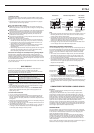
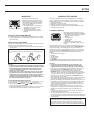
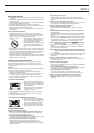
Halftime Model
The term “halftime” refers to half the time it takes for gas (such as nitrogen)
dissolved tissue to equilibrate to a new pressure, or to reach full saturation at
a new pressure. Theoretical tissue half times are used in designing dive
tables and algorithms for dive computers.
Nitrogen dissolves into tissue very quickly at first, with the rate gradually
slowing as the uptake amount increases, until is become extremely slow at
the point of full saturation. The actual full saturation point depends on the
ambient water pressure. Full saturation half time is half the time it takes to
reach full saturation.
Figure 1 shows the saturation of tissue with nitrogen in graphic form. Figure 2
shows the inverse as nitrogen is eliminated a low pressure.