The SmartSwitch 7000 Chassis View
2-18 Viewing Chassis Information
Viewing Interface Detail
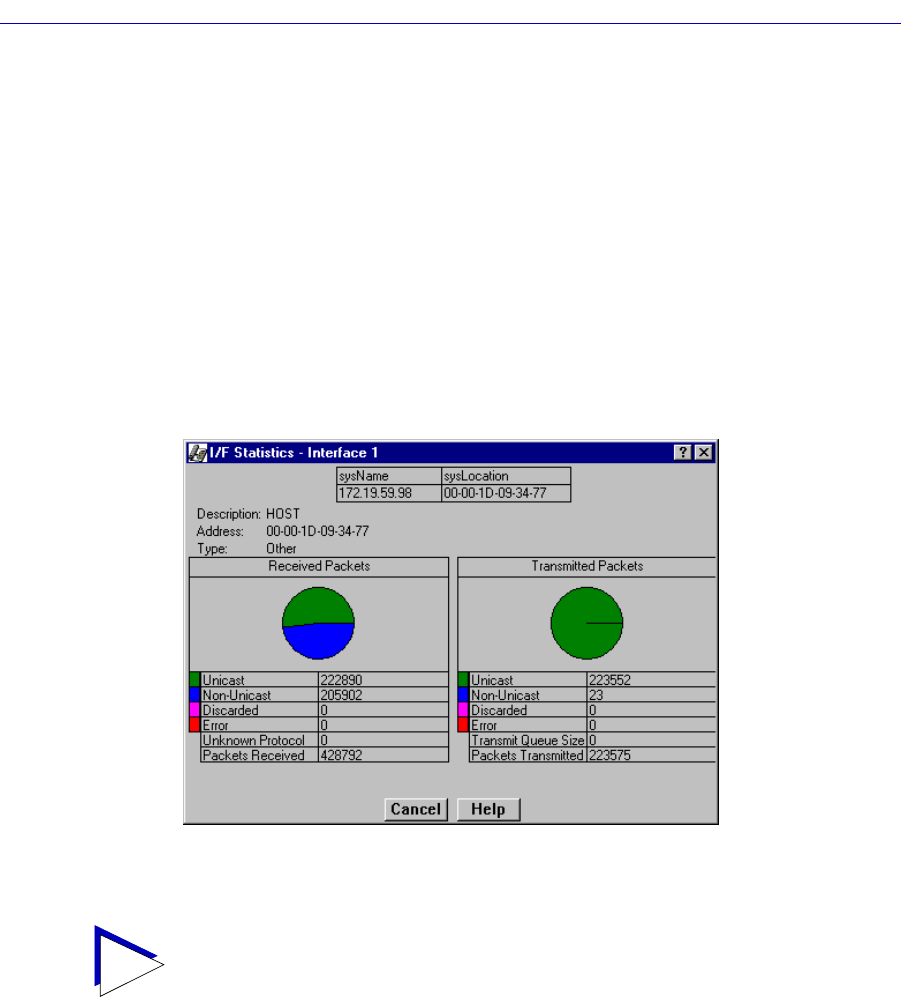
The Interface Statistics window (Figure 2-8) provides detailed MIB-II interface
statistical information Ñ including counts for both transmit and receive packets,
and error and buffering information Ñ for each individual port interface.
Color-coded pie charts also let you graphically view statistics for both received
and transmitted Unicast, Multicast, Discarded, and Error packets.
To open the Interface Statistics window:
1. In the I/F Summary window, click to select the interface for which you’d like to
view more detailed statistics.
2. Click on Detail. The appropriate I/F Statistics window, Figure 2-8, will appear.
Figure 2-8. Detail Interface Statistics
Three informational Þelds appear in the upper portion of the window:
Description
Displays the interface description for the currently selected interface: Ethernet,
FDDI, ATM, or Host.
Address
Displays the MAC (physical) address of the selected interface.
TIP
You can also access this information via the I/F Statistics option available on the
individual port menus; see Chapter 3, Statistics, for more information.