Fabric Watch User’s Guide 1-1
Chapter
1
Introducing Brocade Fabric Watch
This chapter provides the following information:
• Overview on page 1-1
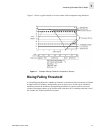
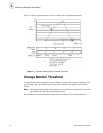
• Threshold Behavior Models on page 1-2
Overview
Brocade Brocade Fabric Watch
TM
is used by SAN managers to monitor key fabric and switch
elements, making it easy to quickly identify and escalate potential problems. It monitors each
element for out-of-boundary values or counters and provides notification when any exceed the
defined boundaries. The SAN manager can configure which elements, such as error, status, and
performance counters within a SilkWorm switch, are monitored.
Brocade Fabric Watch
TM
is an optionally licensed product that runs on SilkWorm 2000 series
switches and above with Brocades Fabric OS™ version v3.0. Brocade Fabric Watch
TM
can be
accessed through:
• Brocade Web Tools
• A telnet interface
• A SNMP-based enterprise manager
• By modifying and uploading the Brocade Fabric Watch
TM
configuration file to the switch.
Brocade Fabric Watch
TM
monitors the following elements:
• Fabric events (such as topology reconfigurations, zone changes)
• Switch environment (fans, power supplies, and temperature)
• Ports (state changes, errors, and performance)
• GBICs (for switches equipped with SMART GBICs.
Example: the Finiasr SMART GBIC FTR-8519-3).
With Brocade Fabric Watch
TM
installed, each switch continuously monitors error and performance
counters against a set of defined ranges. This and other information specific to each monitored
element is made available by Brocade Fabric Watch
TM
for viewing and, in some cases,
modification. This set of information about each element is called a threshold, and the upper and
lower limits of the defined ranges are called boundaries.
If conditions break out of acceptable ranges, an event is considered to have occurred, and one or
more of the following alarms (reporting mechanisms) are generated if configured for the relevant
threshold:
• SNMP trap


