


— 7 —
Current
altitude
Altitude
alarm
setting
Current
altitude
Altitude
alarm
setting
• Segments in the graphic display darken as you approach the altitude
alarm setting. If you ascend away from the altitude alarm setting, the
darkened segments are cleared from the graphic display.
• All 10 segments are darkened when you reach or exceed the altitude set
for the altitude alarm.
• If your current altitude is higher than that registered for the initial
measurement, none of the graphic display segments are darkened.
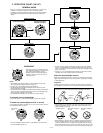
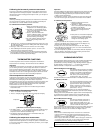
To recall altitude measurement data from memory
1. Use C to enter the Data Recall Mode.
2. Press D to scroll forward through the stored data items or B to scroll
backward.
• Holding down either button scrolls through the data items at high speed.
• The data item that is displayed when you exit the Data Recall Mode is still
displayed the next time you enter the Data Recall Mode.
*
It shows nine segments between the maximum and minimum altitudes
achieved during a memory measurement. The segments indicate how
altitude changed during the measurement.
• The maximum and minimum altitudes achieved during a measurement
operation are also stored in memory. When the maximum altitude is
recalled, the message “MAX” alternates every second with the date in the
upper display. The message “MIN” appears for the minimum altitude.
• Measured data is stored in memory even if an error occurs during the
measurement. For details on errors, see “Warning Indicators”.
D
B
D
B
D
B
D
B
Altitude graphAltitude
Temperature
Mode indicator
*
A
B
C
D
E
AUTO
RECALL
C
m
A S
Date
AUTO
RECALL
C
m
A S
P
AUTO
RECALL
C
m
A S
[ Initial Display ]
[ Final Display ]
BAROMETER FUNCTIONS
This watch uses a pressure sensor to measure atmospheric pressure. This
sensor can be calibrated.
Important!
The barometer that is built into this watch measures changes in
atmospheric pressure, which you can then apply to your own weather
predictions. It is not intended for use as a precision instrument in official
weather prediction or reporting applications.
Example barometer applications
• Before going mountain climbing, you can take readings to find out the
probable upcoming weather.
• You can predict the weather for golf or other outdoor activities.
About barometric measurements
The barometer automatically takes measurements every two hours (starting
from midnight), regardless of what mode you are in. The last measurement
result, along with the current temperature is displayed in the Timekeeping Mode.
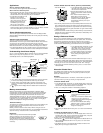
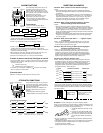
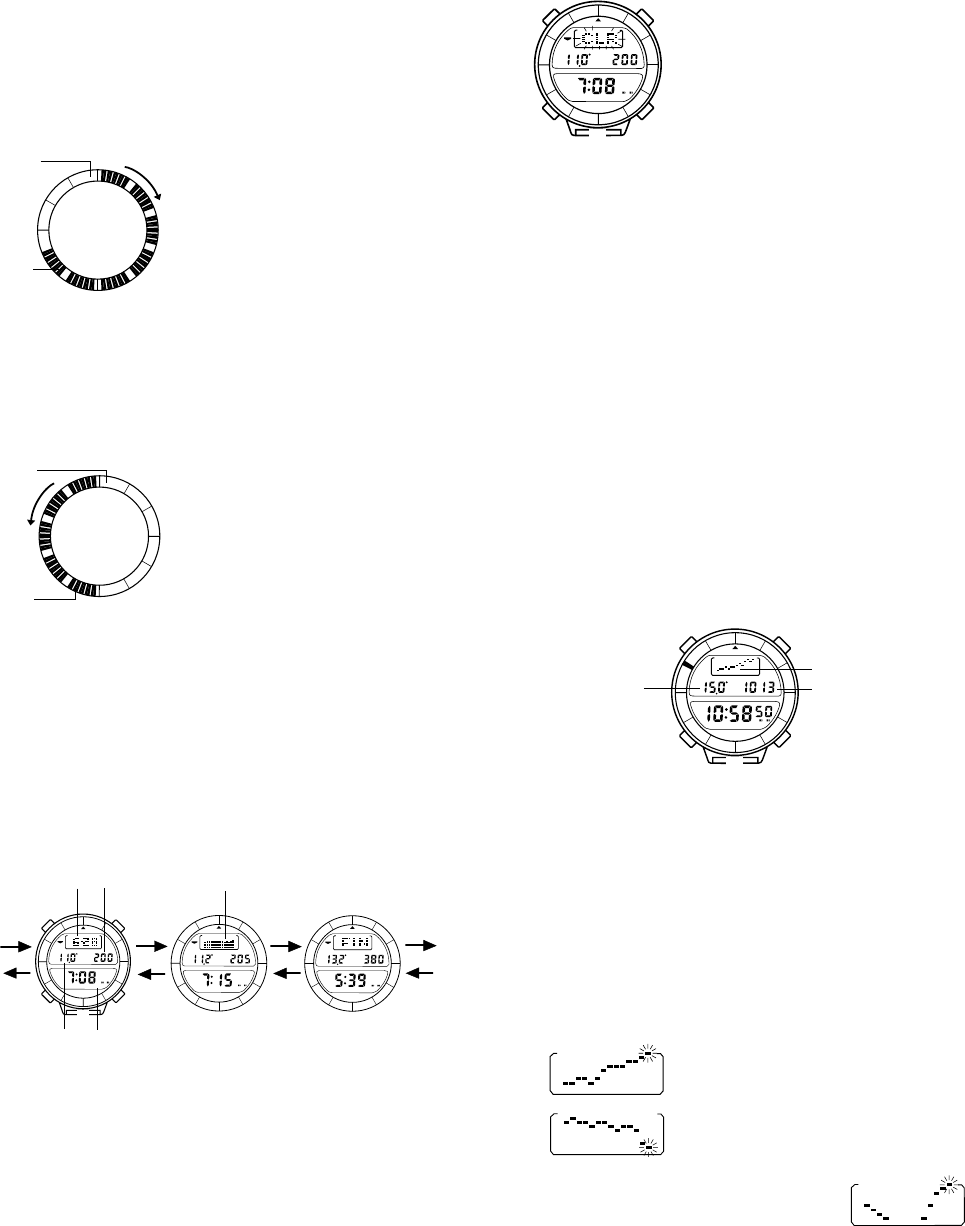
Understanding the barometer display
1. Use C to enter the Timekeeping Mode.
2. Press D to display the Barometric Pressure/Temperature Display.
*
1 The barometric pressure graph shows the barometric readings for the
past 26 hours. The flashing point on the right of the display is the point
for the last measurement.
*
2 Some countries call to this unit as hecto-pascal (hPa), while other
countries call it millibars (mb). It really makes no difference, because
1 hPa = 1 mb. In this manual, we will refer to hPa/mb or hPa (mb).
*
3 The display shows “– – – – hPa/mb” if a measured value falls outside
the range of 610 hPa/mb to 1100 hPa/mb. The normal display will return
as soon as the pressure returns within the allowable range.
Using the barometric pressure graph
Changes in barometric pressure are caused by changes in the weather and
temperature. The following shows how to interpret the data that appears on
the barometric pressure graph.
A rising graph generally means better
weather.
A falling graph generally means
deteriorating weather.
Note that if there are sudden changes in weather or
temperature, the graph line of past measurements
may run off the top or bottom of the display. The
entire graph will become visible once atmospheric
conditions stabilize.
The following conditions cause the barometric pressure measurement to be
skipped, with the corresponding point on the barometric pressure graph
being left blank.
• Barometric reading that is out of range (610 hPa/mb to 1100 hPa/mb)
• Sensor malfunction
• Dead battery
A
B
C
D
E
P
C
hPamb
A S
Temperature
Barometric pressure graph
(unit: 1 hPa/mb
*
2
)
*
1
Last measurement
(updated every 2 hours)
*
3
[ Barometric Pressure/Temperature Display ]
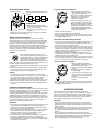
Important!
You cannot delete data while a memory measurement is in progress
(“AUTO” flashing on the display).
1. In the Recall Mode, display the initial
data of the set of memory data you want
to delete.
• Display the maximum altitude or the
minimum altitude if you want to delete it.
2. To clear the data, hold down A until the
watch emits a long beep (and until “CLR”
stops flashing on the display).
A
B
C
D
E
AUTO
RECALL
C
m
A S
To delete data from memory
The following procedure deletes a entire set (from start measurement to
end measurement) of memory data.
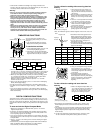
About the graphic display
In the Altimeter Mode, the graphic display normally indicates the counting of
the current time’s seconds. When a memory measurement operation is being
performed while the altitude alarm is on, however, the watch automatically
divides the graphic display into 10 equal parts. Each part represents 1/10 of
the difference between the first altitude measured by the memory
measurement operation and the value you set as the altitude alarm. The
graphic representation gives you some idea of how much farther you must
go to reach the altitude indicated by the altitude alarm setting.
• The graphic representation described below is not shown on the display if
the altitude alarm is switched off.
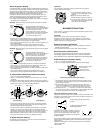
Example: When the initially measured altitude is less than the altitude
alarm setting.
The graphic display would appear as
illustrated here when your current altitude is
700 meters, after you set the altitude alarm
for 1000 meters and the initial
measurement was 0 meters. Note that
seven segments of the graph are darkened
because you are 7/10 of the way to the
value set for the altitude alarm.
• Segments in the graphic display darken as you approach the altitude
alarm setting. If you descend away from the altitude alarm setting, the
darkened segments are cleared from the graphic display.
• All 10 segments are darkened when you reach or exceed the altitude set
for the altitude alarm.
• If your current altitude is lower than that registered for the initial
measurement, none of the graphic display segments are darkened.
Example: When the initially measured altitude is greater than the altitude
alarm setting.
The graphic display would appear as
illustrated here when your current altitude is
1500 meters, after you set the altitude
alarm for 1000 meters and the initial
measurement was 2000 meters. Note that
five segments of the graph are darkened
because you are 5/10 of the way to the
value set for the altitude alarm.